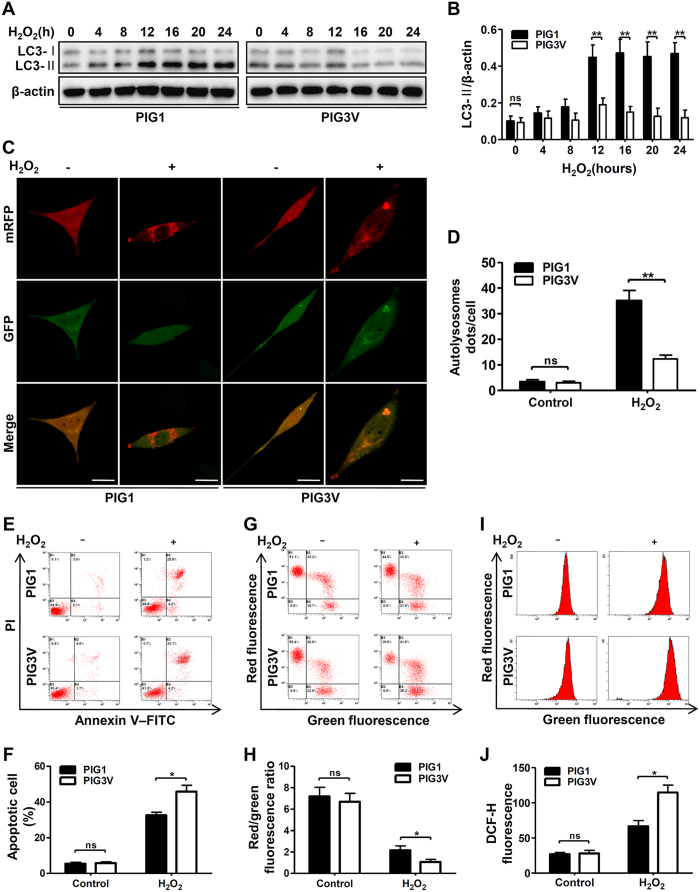
Figure 3. The difference in autophagy flux and cells sensitivity after H2O2 treatment between PIG1 and PIG3V cells.
(A) Immunoblots of LC3 in PIG1 and PIG3V cells treated with H2O2 (0.5 mM) for different hours. (B) Band intensity normalized to β-actin is expressed as mean ± SD, **p < 0.01. (C) PIG1 and PIG3V cells were transfected with adenovirus expressing mRFP-GFP-LC3. After a 24-hour transfection, cells were treated with or without H2O2 for 12 hours. As shown in merged confocal images, the yellow puncta indicate the autophagosome while the red puncta indicate the autolysosome. Scale bars represent 5 μm. (D) The number of autolysosome dots were counted on 40 cells in a minimum of 3 experiments and expressed as mean ± SD, **p < 0.01. (E) PIG1 and PIG3V cells were treated with H2O2 for 24 hours, and the level of apoptosis was detected by flow cytometry assay. (F) The level of apoptosis are presented as the mean ± SD, *p < 0.05. (G) PIG1 and PIG3V cells were treated with H2O2 for 24 hours, and the MMP was measured by flow cytometry assay. (H) Quantification of MMP are presented as the mean ± SD, *p < 0.05. (I) PIG1 and PIG3V cells were treated with H2O2 for 24 hours, then the intracellular ROS level were measured by flow cytometry assay. (J) Quantification of intracellular ROS level are presented as the mean ± SD, *p < 0.05.

