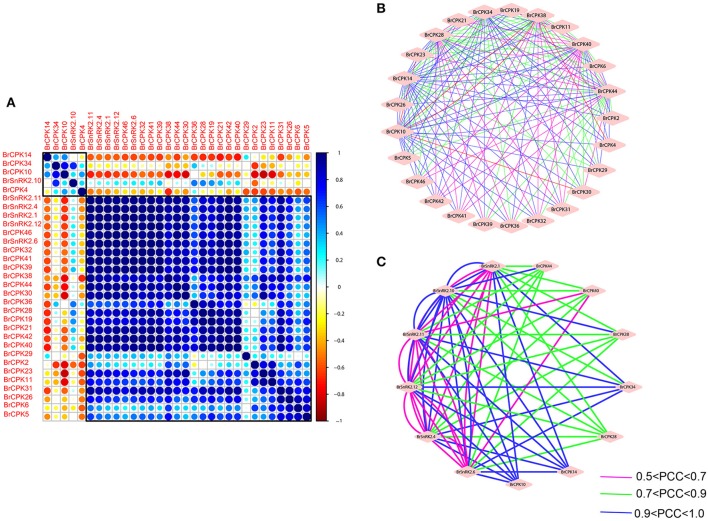
Figure 11.
Correlations and co-regulatory networks of 31 BrCDPK-SnRK genes under stress treatments. (A) Correlation analysis using the R package program. Each correlation is shown by the shades of blue and orange and the size of the circle shape. Blue and orange indicate a positive correlation and negative correlation, respectively. (B,C) Co-regulatory networks. The co-regulatory networks of 31 BrCDPK-SnRK genes under stress treatments were established based on the Pearson correlation coefficients (PCCs) of these gene pairs using transformed qPCR data. The PCC of co-regulatory gene pairs was considered significant at the 0.05 significance level (p-value), and different line colors and styles indicate the different significance levels of the co-regulated gene pairs.

