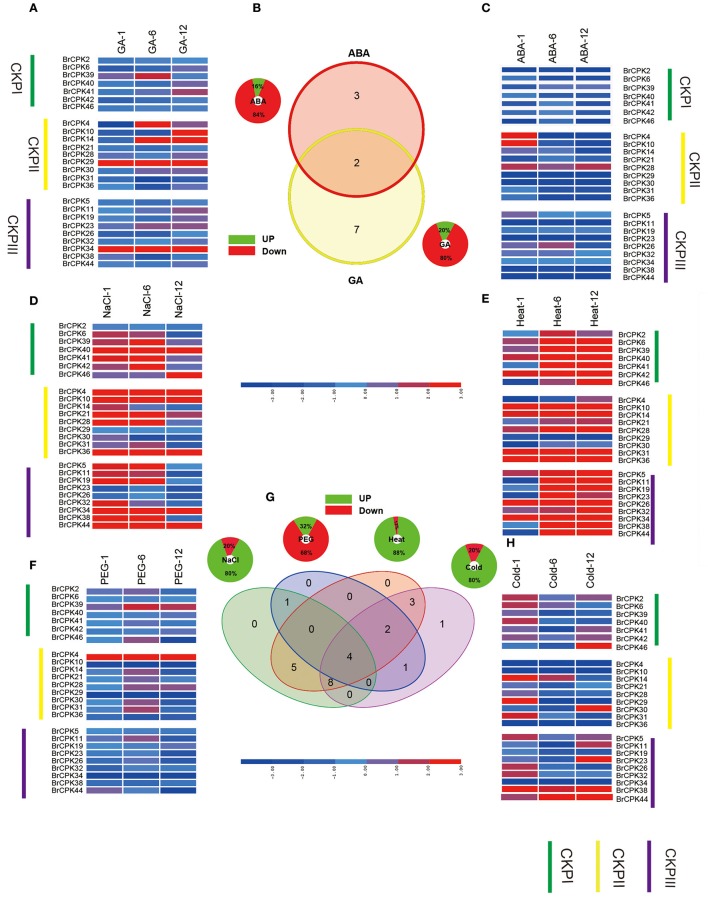
Figure 9.
Expression analysis of the BrCPK genes under six stress treatments in Brassica rapa. (A,C–F,H) Heat map representation the BrCPK genes under six stress treatments, namely, GA, ABA, NaCl, heat, PEG, and cold. (B,G) Venn diagram depicting the distribution of shared expression of the BrCPK genes among hormone and abiotic treatments.

