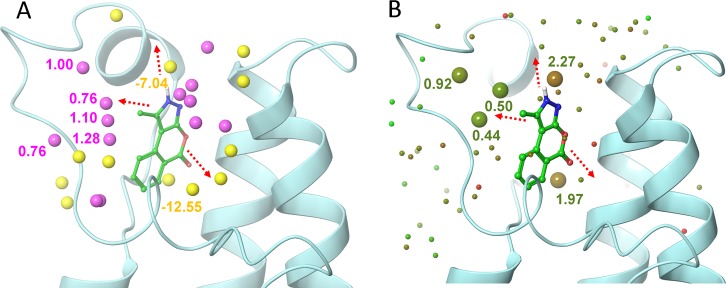
Figure 5.
Comparison of the 9–PB1(5) complex hydration analysis results obtained using SZmap and Watermap. (A) Hydration sites predicted using SZmap algorithm are shown as yellow (negative ΔG, stable) and magenta (positive ΔG, unstable) spheres. (B) Water molecules predicted for 9–PB1(5) complex using Watermap algorithm are depicted as spheres colored according to their ΔG (green, low; red, high). The three most feasible extension vectors of the pyrazoloisocoumarin scaffold are depicted as red dashed arrows, and the related protein solvation sites are marked with their corresponding energy values in kcal/mol. The two methods afforded fairly comparable results showing highest convergence toward predicting unstable solvent molecules of ZA channel as the most promising hydration site that was therefore targeted by structural modifications of the hit.

