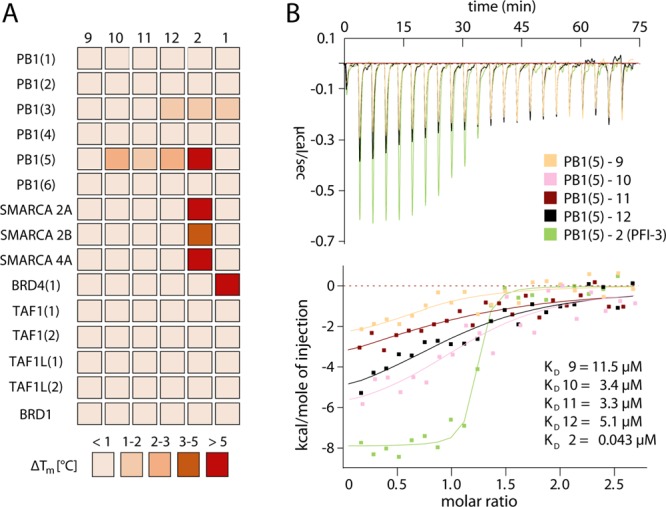
Figure 6.

Potency and selectivity of synthesized analogues to compound 9. (A) Temperature shift assays of compounds 9–12 on subfamily VIII BRDs as well as selected other bromodomains. The inhibitors 1 and 2 were added for comparison. The heat map is color coded as described in the figure. (B) Isothermal titration calorimetry data for compounds 9–12 as well as 2. Shown are raw binding heats after baseline subtraction as well as normalized binding heats (lower panel). The solid lines represent nonlinear least-squares fits to the experimental data, and experimental binding heats are color coded as indicated in the figure. The Kd values determined for each experiments are also shown. All fitted and calculated thermodynamic data are shown in Supporting Information, Table S6.
