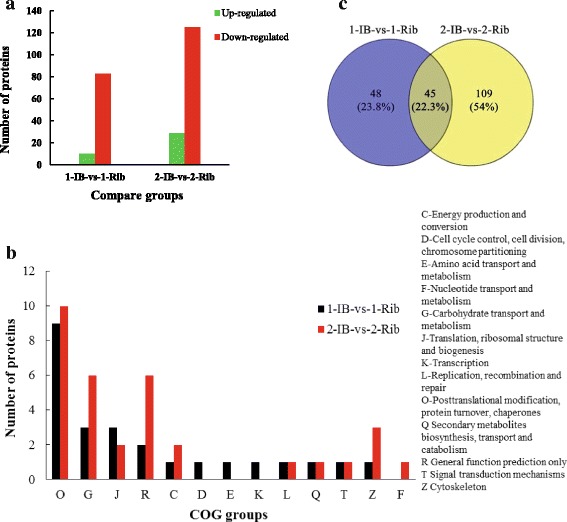
Fig. 3.

Comparison of proteins identified in 1-IB-vs-1-Rib and 2-IB-vs-2-Rib groups. a indicates differential expressed proteins, X-axis: names of the comparison groups; Y-axis: the number of differentially expressed proteins; Red column: up-regulation proteins; Green column: down-regulation proteins. b shows COG functional classification of differentially expressed proteins in two comparison groups. c shows Venn diagram for differentially expressed proteins between 1-IB-vs-1-Rib and 2-IB-vs-2-Rib
