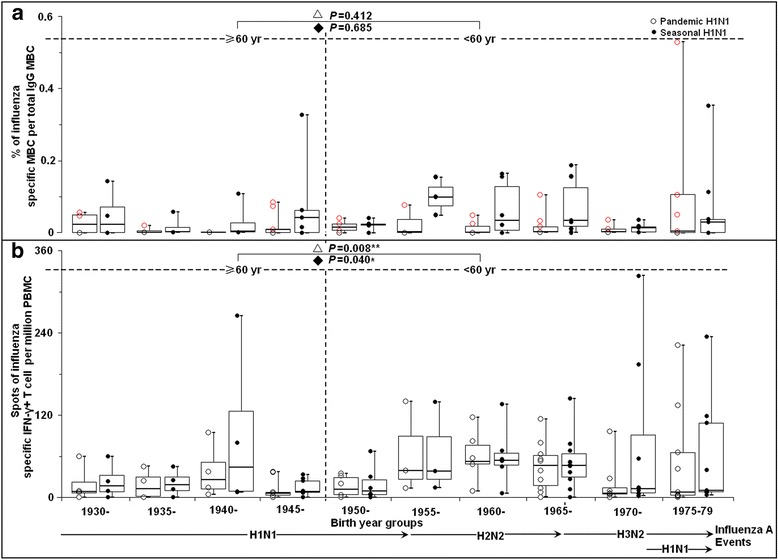
Fig. 2.

The overall response patterns of pre-pandemic influenza specific B and IFN-γ+ T cell immunities from the same individual against pandemic and seasonal H1N1 grouped by the year of birth. a Frequency of influenza hemagglutinin (HA) specific memory B cell as a percentage of the total IgG+ memory B cells. MBCs, memory B cells. b Frequency of IFN-γ+ T cell per million PBMCs stimulated with live influenza viruses. The data were presented as dot plot of the raw data, overlaid by box-and-whisker plot (median, first and third percentile, range). Blank circle point in red represents as the positive for HA specific MBCs of H1N1 pdm. Pandemic H1N1, A/California/07/2009 (H1N1). Seasonal H1N1, A/Brisbane/59/2007 (H1N1). The horizontal line in each column indicates the median value. ≥60 years: equal and older than 60 years old; <60 years: younger than 60 years old. P value was calculated between people over and under 60 years old △stimulate with pandemic and ◆seasonal influenza virus
