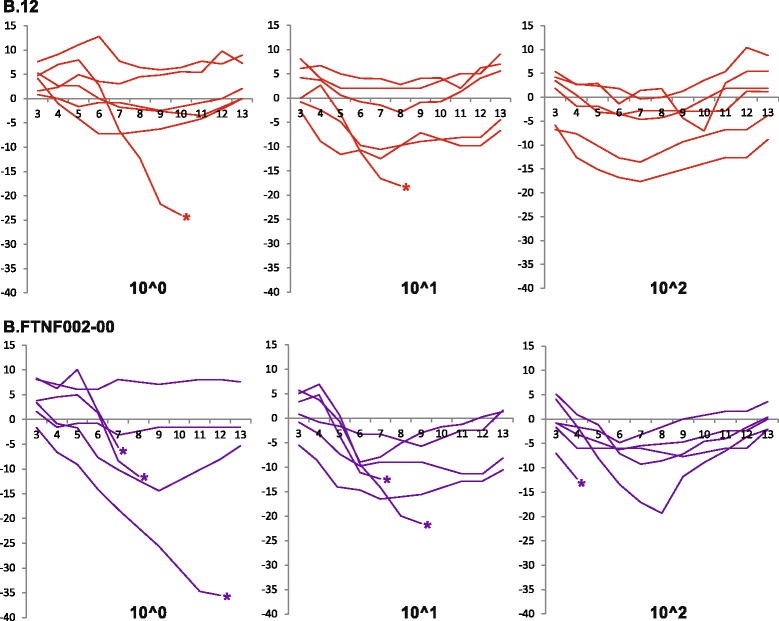
Fig. 1.

Comparison of changes in body weight in Francisella tularensis ssp. holarctica infected Fischer 344 rats. Fischer 344 rats were infected with three concentrations of F. tularensis ssp. holarctica genotype B.12 (red) or B.FTNF002-00 (purple). Challenge doses are given under each diagram in colony forming units. Values are representing the percent change in body weight between days 3 and 13 post infection relative to the initial weight on the day of infection for each animal. Positive values representing weight gain, while negative values are showing weight loss. Asterisks are representing the death of the animals
