
Fig. 2.
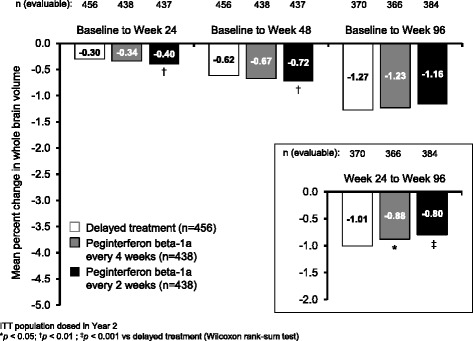
Percentage reduction in whole brain volume from baseline, and from Week 24 (inset). ITT population dosed in Year 2. *p < 0.05; † p < 0.01; ‡ p < 0.001 vs delayed treatment (Wilcoxon rank-sum test)
Official websites use .gov
A
.gov website belongs to an official
government organization in the United States.
Secure .gov websites use HTTPS
A lock (
) or https:// means you've safely
connected to the .gov website. Share sensitive
information only on official, secure websites.
Percentage reduction in whole brain volume from baseline, and from Week 24 (inset). ITT population dosed in Year 2. *p < 0.05; † p < 0.01; ‡ p < 0.001 vs delayed treatment (Wilcoxon rank-sum test)