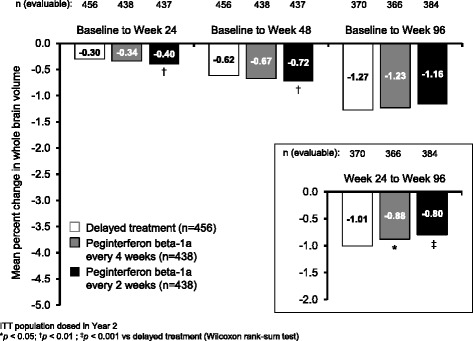
Fig. 2.

Percentage reduction in whole brain volume from baseline, and from Week 24 (inset). ITT population dosed in Year 2. *p < 0.05; † p < 0.01; ‡ p < 0.001 vs delayed treatment (Wilcoxon rank-sum test)

Percentage reduction in whole brain volume from baseline, and from Week 24 (inset). ITT population dosed in Year 2. *p < 0.05; † p < 0.01; ‡ p < 0.001 vs delayed treatment (Wilcoxon rank-sum test)