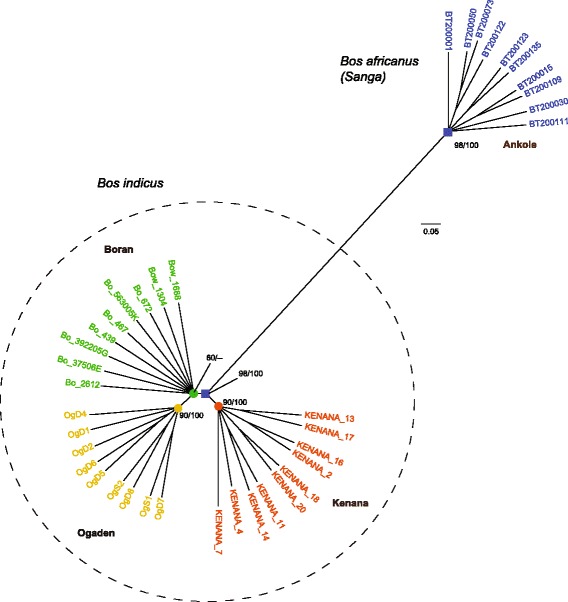
Fig. 1.

Maximum likelihood phylogenomic tree derived from autosomal SNPs of 38 African cattle individuals. The data set (26,427,196 base pairs) was analyzed with maximum likelihood (ML) and neighbor-joining (NJ) methods which revealed identical topologies. The robustness of the phylogenomic analysis is indicated to the respective nodes: left numbers are bootstrap values for ML tree and right ones are quartet puzzling reliability values for NJ tree
