
Fig. 4.
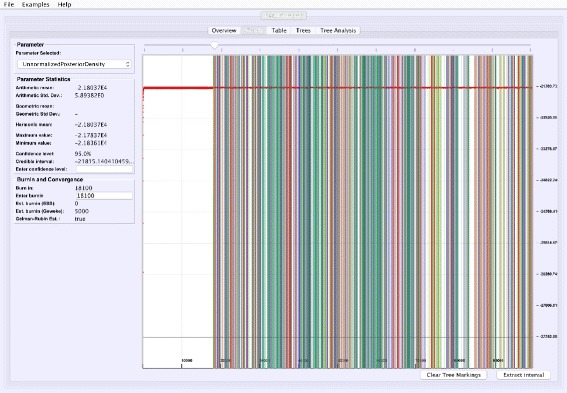
Visualizing tree mixing and parameter dependence: We go back to the Graph tab after selecting the top five trees in Fig. 2 and clicking “Mark selection”. The trace plot is then colored where the selected trees appears in the trace, which is a means of to visualize mixing and to determine the dependency between continuous parameters and trees (the trace plot may be hard to see in the image due to dark colors in print, but the colors are lighter and semi-transparent on screen). For the example trace (in Additional file 3), frequent change of color and no long stretches of a single color is indicative of good mixing for the tree parameter