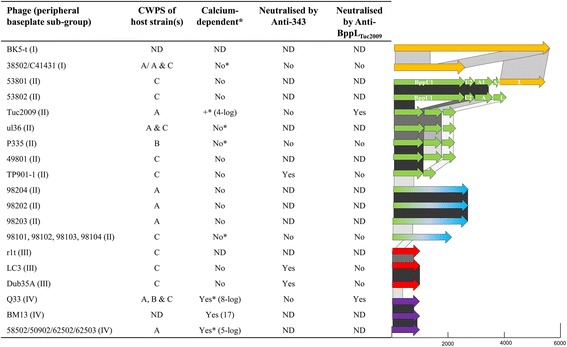
Fig. 4.

The table on the left provides an overview of the results of the calcium dependency assays and antibody neutralisation assays performed against a range of P335 phages. *Denotes that while calcium may or may not be required for plaque formation, its presence has a beneficial effect on plaque size and in the presence of EDTA a reduction in plaque size is observed. ND = Not determined. Note: The Ca-dependent characteristic of BM13 was defined in a previous study [9], while all other results presented are from data generated in this study. The arrow diagrams on the right are representative of the peripheral baseplate-encoding genes to indicate the single/multi-component genetic arrangements of these phages and the relatedness of the various components between the sequenced phage isolates where  indicates 95–100% aa identity;
  indicates 50–95% aa identity and;
  indicates 30–50% aa identity and the colour coding of the peripheral baseplate components are consistent with the RBP group colour coding in Fig. 3B. A representative scale (bp) is provided below the diagram to indicate the relative size of the ORFs encoding the various proteins of the peripheral baseplate region (BppU, BppA and BppL/RBP as appropriate)
