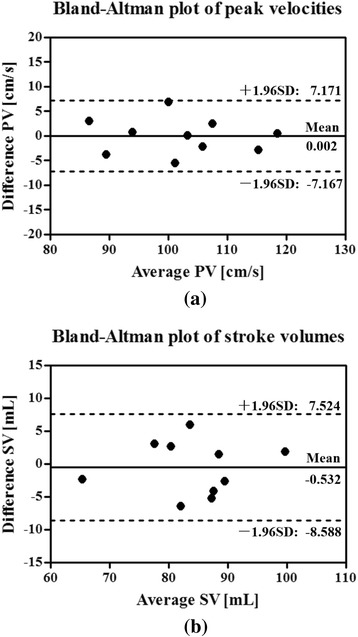
Fig. 6.

Bland-Altman analysis. Bland-Altman analysis of peak velocities (a) and stroke volumes (b) comparing the proposed real-time imaging method with the conventional cine method. The peak velocities and stroke volumes from real-time imaging are the mean values over 30 consecutive cardiac cycles. In the above plots, the central solid horizontal line indicates the mean of the differences in the measurements from two methods, while the outer dotted horizontal lines indicate the lower/upper limits of agreement
