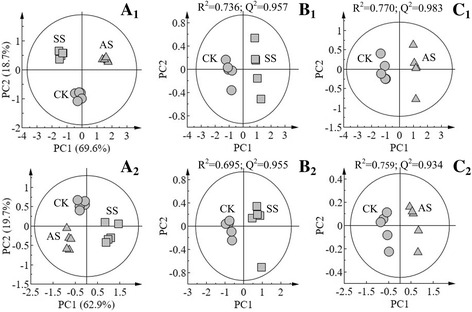
Fig. 2.

Score plots of the principal component analysis displaying the metabolomic trajectory of the root (A 1) and shoot (A 2) of maize seedlings under no salinity stress (CK), neutral salt stress (SS), and alkaline salt stress (AS). Scores obtained by orthogonal partial least-squares discriminant analysis (PLS-DA) exhibiting the dependence of the effects of neutral salt stress on maize on salinity levels: CK vs. SS in roots (B 1) and shoots (B 2); CK vs. AS in (C 1) roots and shoots (C 2)
