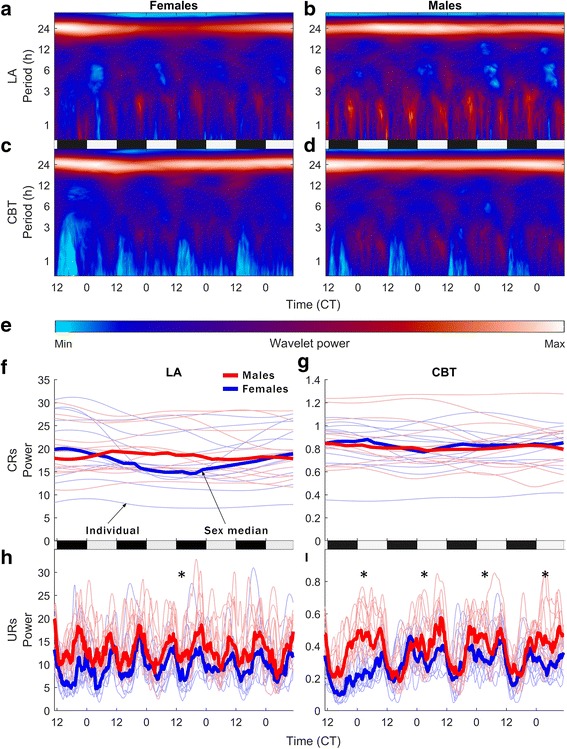
Fig. 2.

Median wavelet transforms (WTs; a–d) of the data that comprise the average depicted in Fig. 1 indicate changes in rhythmic power (e) across periodicities ranging from 1 to 39 h (log y-axis). Day 1 is the day of estrus for females (a, c) and an arbitrary four consecutive days chosen for males (b, d). Females show an effect of day in ultradian CBT, the depression of which identifies estrus (χ 2 = 13.52, p < 5 × 10⁻³). Males do not show an effect of day but exhibit greater power in high frequency (1–3-h periodicity) URs in LA (χ 2 = 34.36, p = 1 × 10⁻⁸). Quantification of individual and median circadian power (CRs, 23−25-h) (f, g) and ultradian power (URs, 1−3-h) (h, i). For CBT, male UR power is greater only during the inactive phase (i). Asterisk indicates a significant sex difference. Both sexes show an effect of time of day for URs in CBT, but males have nearly twice the ultradian change of females (χ 2 = 54.83, p < 1 × 10⁻¹² for males; χ 2 = 30.61, p < 1 × 10⁻⁷ for females). No sex difference is detectable in the circadian range (23–25-h)
