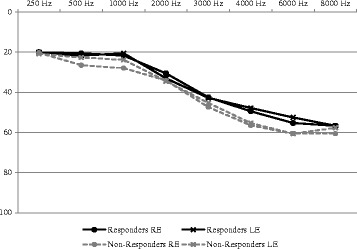
Fig. 1.

Mean audiograms for responders and nonresponders. Legend: Solid black lines with circles represent responders’ right ear mean audiometric thresholds; solid black lines with “x” represent responders’ left ear mean audiometric thresholds; dotted gray lines with circles represent nonresponders’ right ear mean audiometric thresholds; dotted gray lines with “x” represent nonresponders’ left ear mean audiometric thresholds
