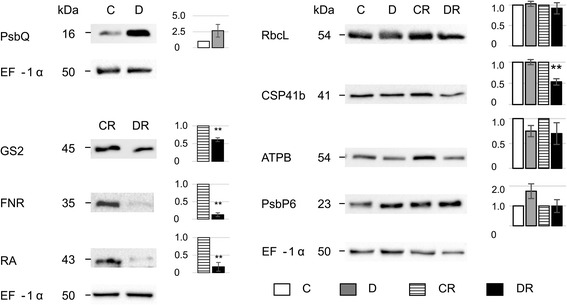
Fig. 3.

Representative western blot validation of selected differentially regulated proteins as detected by proteomic experiments. Equal protein loading was confirmed with the anti-elongation factor (EF-1α) antibody. Histograms (on the right) represent relative protein abundance in C, D, CR and DR plants. C control, D drought-stressed, CR control-recovered, DR drought-recovered plants. Protein levels are mean ± SD, n = 3 (** P ≤ 0.01)
