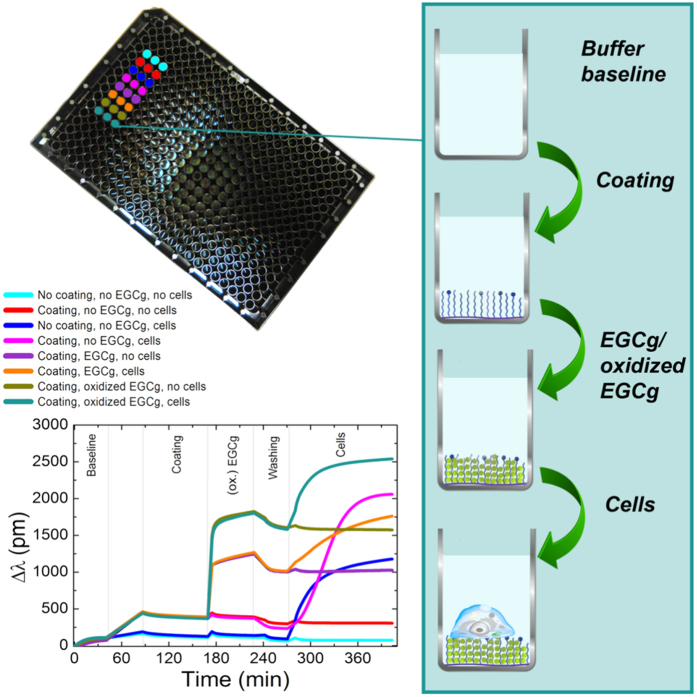
Figure 3. In situ kinetic curves recorded by the Epic BT instrument.
A 384-well plate used in the experiment is also shown, together with the manipulation steps in a typical well (right scheme). Typical experimental curves are plotted (bottom left corner) for PP:PPR coating and 500 μg/ml EGCg concentration. The detailed experimental conditions corresponding to the various kinetic curves are indicated above the graph.

