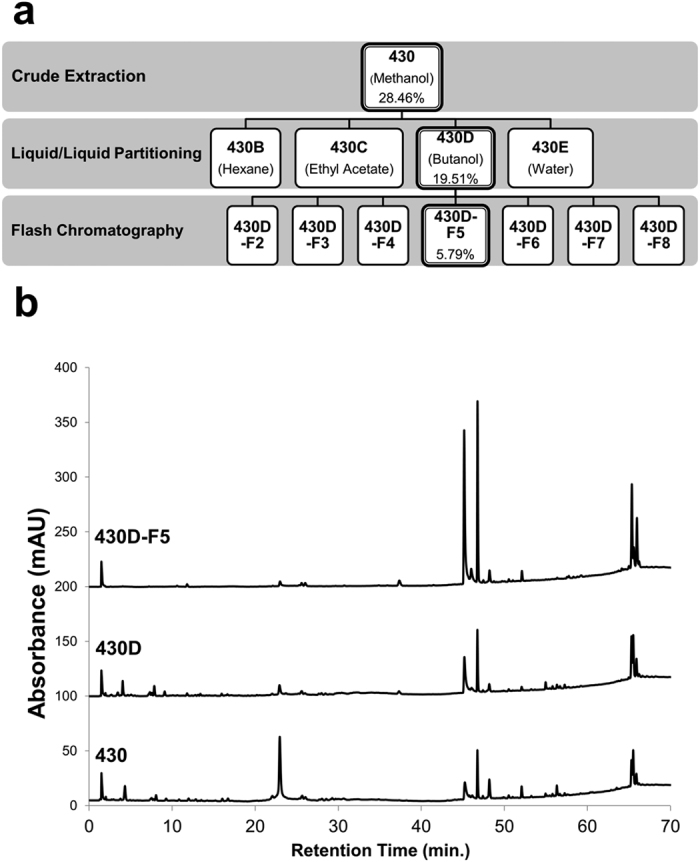
Figure 2. Isolation scheme of bioactive fraction 430D-F5.

(a) The bioassay-guided fractionation scheme is illustrated, demonstrating the path from crude fruit extract to refined bioactive fraction 430D-F5. Percent yields of extracts in relation to starting dry plant material are represented at each separation step. The most active fractions at each step are highlighted in bold. (b) The corresponding HPLC chromatograms for the most active fractions demonstrate an increase in relative abundance of peaks at a retention time range of 45–50 min.
