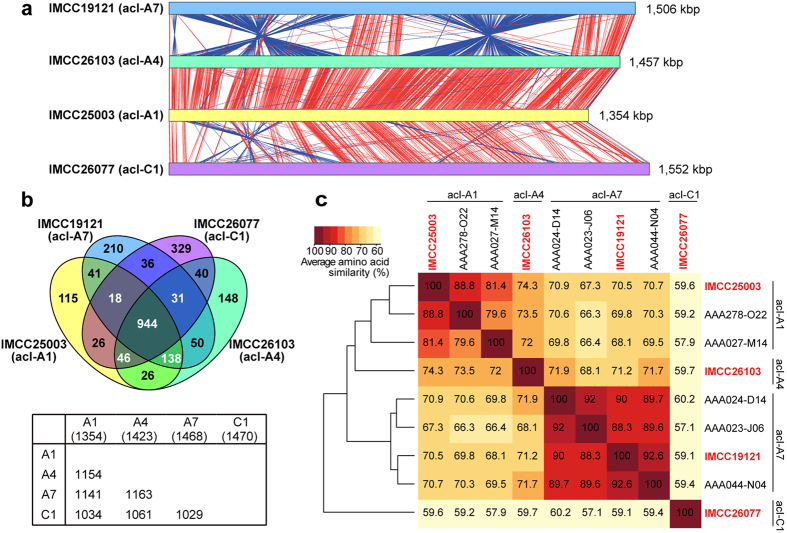
Figure 2. Genomic comparison of the acI genomes.
(a) BLASTn based comparison of the acI genomes. Matches satisfying the length (≥60 bp) and score (≥50) cutoffs were displayed as red (same orientation) and blue (reverse orientation) blocks using the Artemis Comparison Tool. (b) Venn diagram showing the number of shared and unique protein clusters (PCs) among the acI genomes, as analyzed using GET_HOMOLOGUES. The lower table shows the number of shared PCs between the genome pairs. Note that the total number of PCs of each genome is slightly smaller than the total number of CDSs, due to putative paralogous proteins. (c) AAI among the acI genomes obtained in the present study and related SAGs. AAI values were obtained from GET_HOMOLOGUES. Clustering of genomes based on AAI were performed using the ‘hclust’ function of R.

