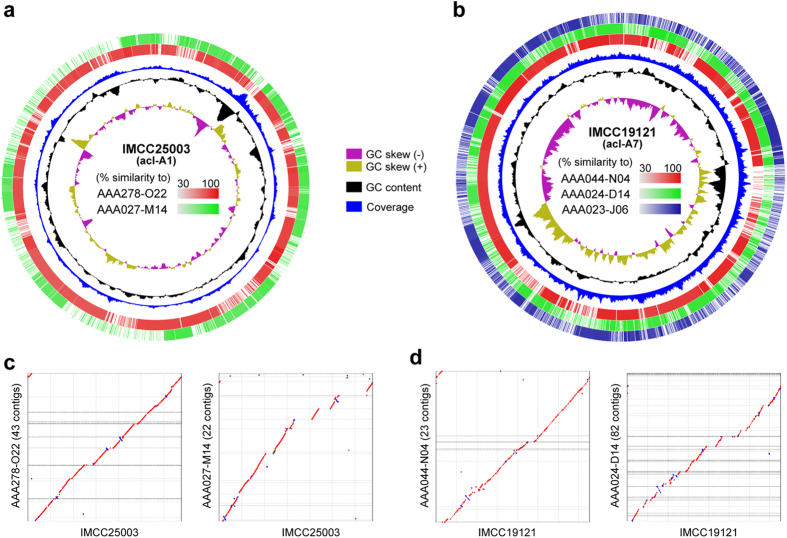
Figure 3. Comparison of the complete acI genomes and the SAGs of the same tribes.
(a and b) BLASTn-based similarity analysis of the acI-A1 tribe (IMCC25003 and two SAGs) (a) and the acI-A7 tribe (IMCC19121 and three SAGs) (b). Similarity plots were drawn by BRIG with a similarity cutoff of 30%. Plots of GC skew and GC content were adopted from the respective genome maps (Supplementary Fig. S2). Coverage data are the same as those presented in Supplementary Fig. S3. (c and d) Synteny plots between the complete genomes and the SAGs of the tribes A1 (c) and A7 (d). Plots were drawn using MUMmer (Promer), after contig reordering by progressiveMauve.

