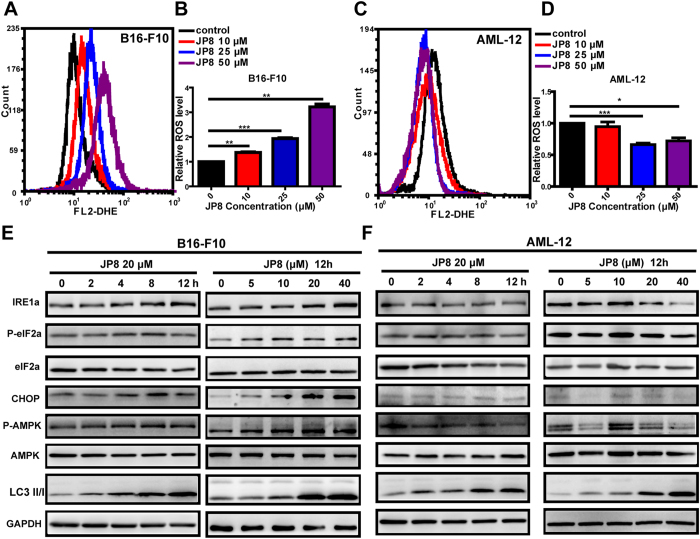
Figure 4. JP8 selectively induces ROS accumulation and stress response-related proteins in B16-F10 cells.
JP8 treatment increases ROS in the cancer cell line B16-F10 (A and B) but not the normal cell line AML-12 (C and D). Cells were treated with JP8 at the indicated concentrations for 24 h and stained with dihydroethidium (DHE). Intracellular ROS levels were analyzed with flow cytometry. B16-F10 (E) and AML-12 (F) cells were treated with JP8 for the indicated times and at the indicated concentrations, and then, the protein expression levels of IRE1a, p-elF2a, elF2a, CHOP, p-AMPK, AMPK, and LC3 were assessed. GAPDH was used as a loading control. Western blot results are representative of three independent experiments with identical results. Bar graphs represent the fold increase in ROS in three independent experiments expressed as the mean ± SEM, *P < 0.05, **P < 0.01, ***P < 0.001 compared to the control.

