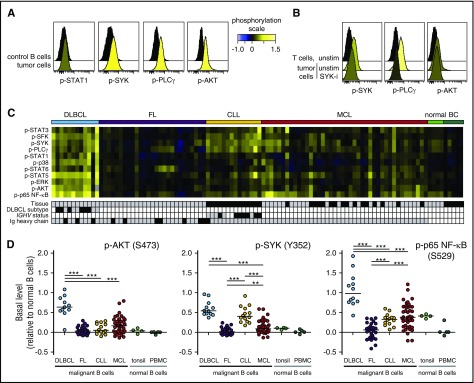
Figure 1.
Elevated basal phosphorylation levels in subgroups of lymphoma patients. Single-cell suspensions from lymphoma patients or healthy donors were thawed and rested for 90 minutes before fixation, permeabilization, and staining with a combination of phosphospecific and lineage-marker–specific antibodies, followed by fluorescent flow cytometric measurements. Tumor cells were identified as CD20+BCL2+CD5−CD3− cells (FL, DLBCL) or CD20+BCL2+CD5+CD3− cells (MCL, CLL), normal B cells as CD20+CD5−CD3−, and T cells as CD20−CD5+CD3+. (A) Histogram overlays of basal (untreated) phosphorylation levels in MCL cells, relative to the basal level in healthy donor PBMC B cells. (B) Patient samples were left untreated or treated with the SYK inhibitor fostamatinib (SYK-i, 2.5 μM) for 1 hour. Shown are histogram overlays of phosphorylation levels in unstimulated (unstim) and fostamatinib-treated MCL cells, as compared with the level in unstimulated intratumor T cells. (C) Heatmap of basal phosphorylation levels across different types of NHLs. Each column represents a patient sample, and the rows were clustered for visual clarity (dendrogram not shown). Samples were annotated for tissue (gray, LN; black, peripheral blood), DLBCL subtype (gray, GCB; black, non-GCB; white, not determined [n.d.]), IGHV status (gray, unmutated: <2% change in IGHV gene sequence compared with germ line; black, mutated; white, n.d.) and Ig heavy chain (gray, IgM; black, IgG). (D) Shown are scatter plots of basal p-AKT, p-SYK, and p-p65 NF-κB in lymphoma cells, relative to healthy donor control PBMC B cells. Each dot represents 1 patient sample. In panels A, C, and D, phosphorylation levels are calculated relative to B cells in a healthy donor control sample, using arcsinh transformation. In panel B, phosphorylation is calculated relative to intratumor T cells. DLBCL (n = 12), FL (n = 27), CLL (n = 14), MCL (n = 42). Healthy donor controls: tonsillar B cells (n = 4) and PBMC B cells (n = 5). Statistical difference between NHL types was calculated using the Mann-Whitney nonparametric test (***P < .0001, **P < .005). BC, B cells.

