Fig. 3.

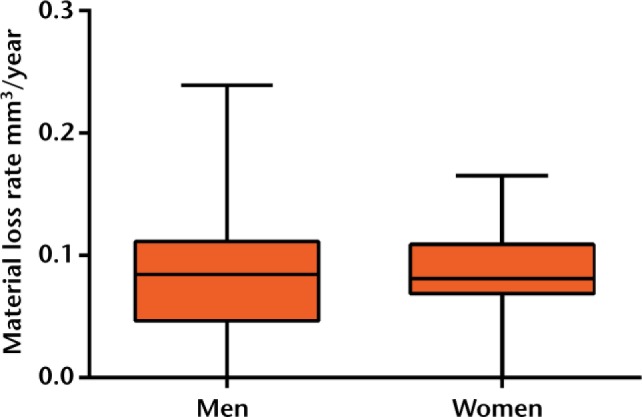
Box plot presenting the annual rate of material loss for male and female patients. The plots present the median values, upper and lower quartiles and the maximum and minimum values of material loss rate.

Box plot presenting the annual rate of material loss for male and female patients. The plots present the median values, upper and lower quartiles and the maximum and minimum values of material loss rate.