Fig. 4.

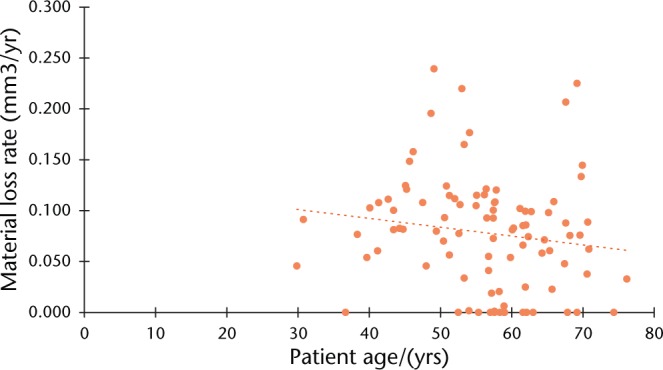
Plot showing the association between patient age (years) and the annual rate of material loss (mm3/year). A line of correlation is fitted with r = 0.

Plot showing the association between patient age (years) and the annual rate of material loss (mm3/year). A line of correlation is fitted with r = 0.