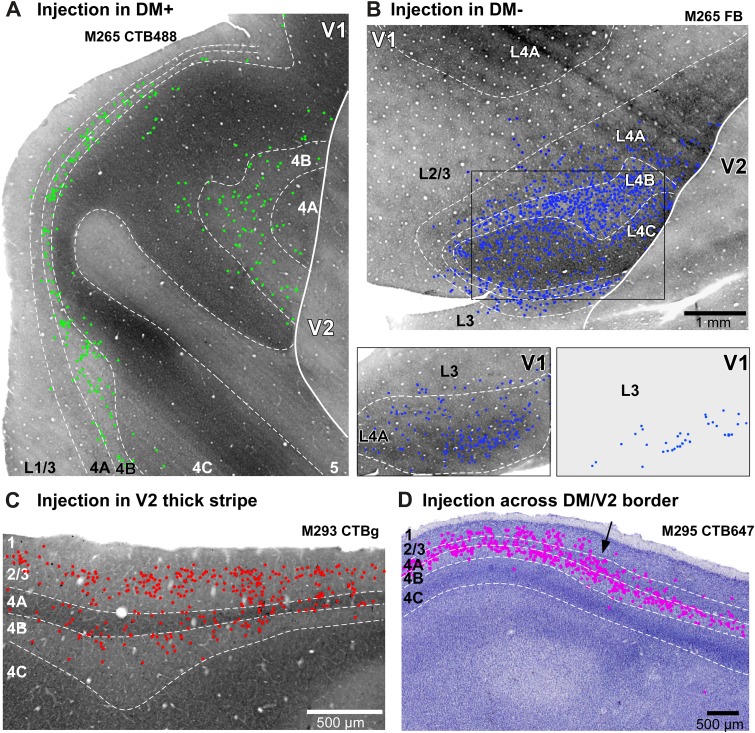
Fig. 4.
Laminar patterns of retrograde label in V1 produced by tracer injections in different cortical areas. (A) Case M265 CTB488. V1 label resulting from the CTB488 injection site in upper field DM (or DM+; green injection site shown in Fig. 3B). Plots of retrogradely labeled cells (green dots) in V1v are shown superimposed on an immediately adjacent CO-stained section (the brain was sectioned tangentially to the pial surface and the CO section was immediately deeper to the section from which the cells were plotted). Here and in panels (B–D) white dashed contours delineate layer boundaries, the white solid contour indicates the V1/V2 border, and numbers indicate V1 layers. (B) Case M265 FB. V1 label resulting from the FB injection in third tier cortex medial to DM+ (blue injection site in Fig. 3B). The top panel shows plots of cell label (blue dots) from a section immediately superficial to the CO-stained section shown, therefore the label that appears to align with layer 4C is, in fact, located in layer 4B in the more superficial section that contains the plotted cells. The black box delineates the region shown in the two bottom panels for the label present in two more superficial sections, respectively; the bottom left panel shows cells located primarily in layer 4A and a few cells in layer 3 aligned to the adjacent deeper CO-stained section, whereas the bottom right panel shows all the label that was present in layer 2/3 in a section just superficial to the section in the left panel. Scale bar in (B) applies to all panels in (A) and (B). (C) Case M293 CTBg (Table 1). V1 label resulting from a CTBg injection in a thick CO stripe of V2 (the injection site is shown in Fig. 7B of Jeffs et al., 2013). Cell label (red dots) was plotted from the same CO-stained section that was also reacted for CTBg. Injections in other stripe types of V2 typically produce a smaller amount of cell label in layer 4B compared to injections in thick stripes (see Federer et al. 2009). (D) Case M295 CTB647 (Table 1). V1 label resulting from a CTB647 injection straddling the border between V2d and upper field DM (injection site shown in Fig. 3B of Jeffs et al., 2013). Plots of labeled cells (pink dots) are superimposed onto a Nissl stain of the same section. To the right of the arrow the label pattern is similar to the one resulting from injections in DM+, i.e., it is heavy in layer 4B, sparse in 4A with few labeled cells in layer 3 (as in panel A); instead, to the left of the arrow the label is heavy in layers 2/3, 4A, and 4B (resembling a combination of the V1 laminar patterns seen after DM and V2 injections). This label pattern is consistent with the interpretation that the label to the right of the arrow represents projections from upper field V1 to the portion of the injection site straddling upper field DM, whereas the label to the left of the arrow represents projections from both upper and lower field V1 across the HM representation to both the DM and V2d portions of the injection site which straddles the HM representation between these areas.

