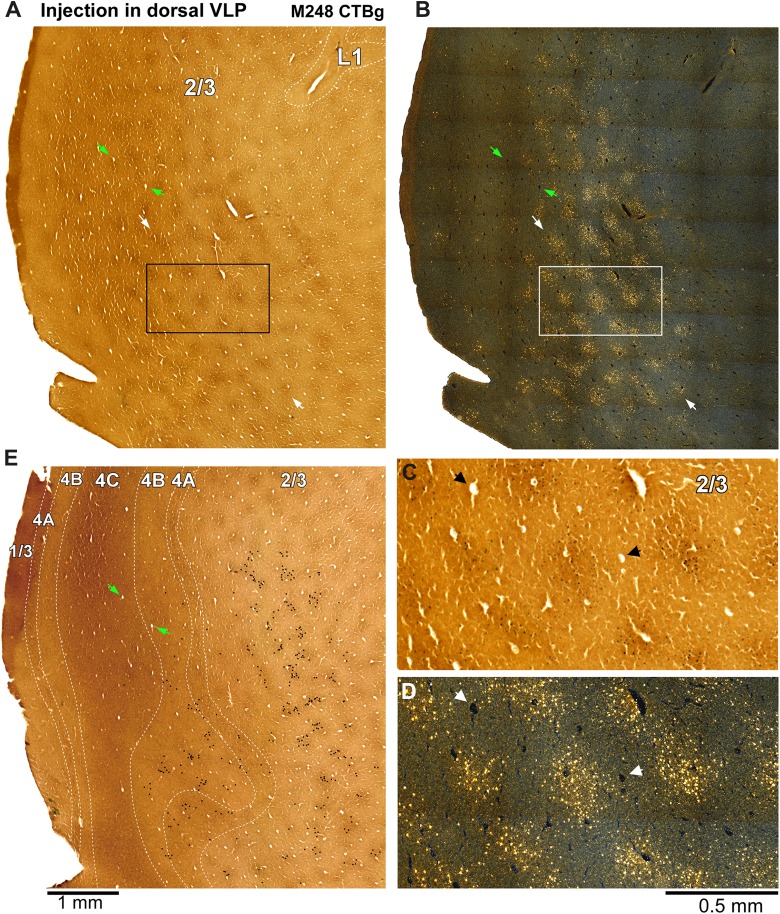
Fig. 7.
Laminar and CO patterns of retrograde label in V1 produced by a tracer injection in third tier cortex lateral to DM+. Case M248 CTBg. (A) Bright-field image of CO-stained tangential section through V1 layer 2/3 showing the CO blob pattern. The same section was silver reacted to reveal CTBg stained cells; these are visible as black dots in panel (C), which shows a higher power view of the boxed region in (A). Dotted white contour/s in panels (A) and (E) indicate laminar boundaries and numbers indicate layers. (B) Dark-field image of the same section in (A) showing the pattern of CTBg cell label. Green arrows in (A, B, E) point at the same blood vessels. White arrows in (A) and (B) point at the same row of CO blobs (in A) and CTBg-labeled patches (in B). Patches of CTBg retrograde label align with the CO blobs. This is better demonstrated in panels (C) and (D). (C, D) Higher magnification of regions boxed in (A) and (B), respectively, to demonstrate alignment of patches of CTBg labeled cells (in D) with CO blobs (in A). Arrows in (C) and (D) point at the same blood vessels. Scale bar under (D) applies also to (C). (E) A CO stained section 240 µm deeper to the section in (A), showing the same V1 region as in (A, B), with superimposed plots of CTBg stained cells (black dots) from the same section. A total of 14 sections (each 40 µm thick) contained dense CTBg label in layer 2/3. In comparison, much sparser label in layers 4A and 4B was present in only 5 sections, indicating a large dominance of cell label in layer 2/3. Scale bar in (E) applies also to (A) and (B).

