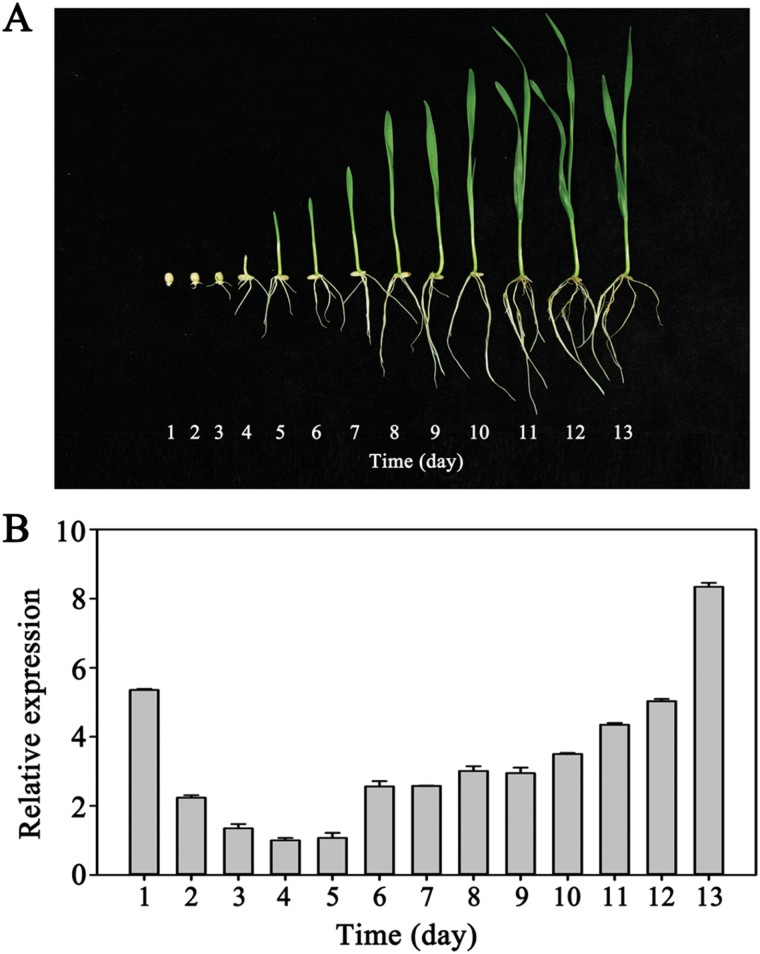
Fig. 7.
Expression pattern of TaMORs from germination to the seedling stage in wheat. (A) Wheat growth status from germination to seedling stage. Embryos and root bases were sampled for TaMORs expression analyses. (B) Expression patterns of TaMORs in embryos and root bases after seed germination. Tubulin activity was used as an internal control. Vertical columns indicate relative transcript levels. Error bars represent the SD of triplicate reactions. The experiment was repeated three times with similar results. This figure is available in colour at JXB online.

