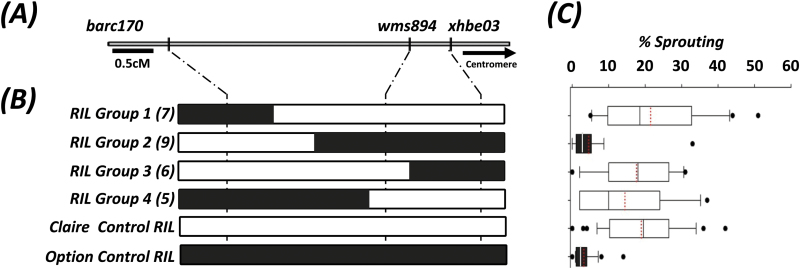
Fig. 3.
Interval mapping of Phs-A1 in the Option × Claire RIL population. (A) Genetic map of the SSR markers flanking Phs-A1. (B) Graphical genotypes of RILs and controls are presented with the Option and Claire alleles represented in black and white, respectively. The RILs are grouped according to their fixed genotype across the Phs-A1 interval and the number of lines in each RIL group is indicated in parenthesis. (C) Sprouting phenotype of RIL groups and controls in sprouting experiment-3. The left and right boundaries of the boxplot indicate the 25th and 75th percentile, respectively, while the error bars (whiskers) on either side of the boxplot indicate the 10th and 90th percentiles. The solid line within the boxplot marks the median (50th percentile) while the red line within the box marks the mean. Boxes with the same colour are similar to each other based on pairwise comparisons.

