Fig. 5.
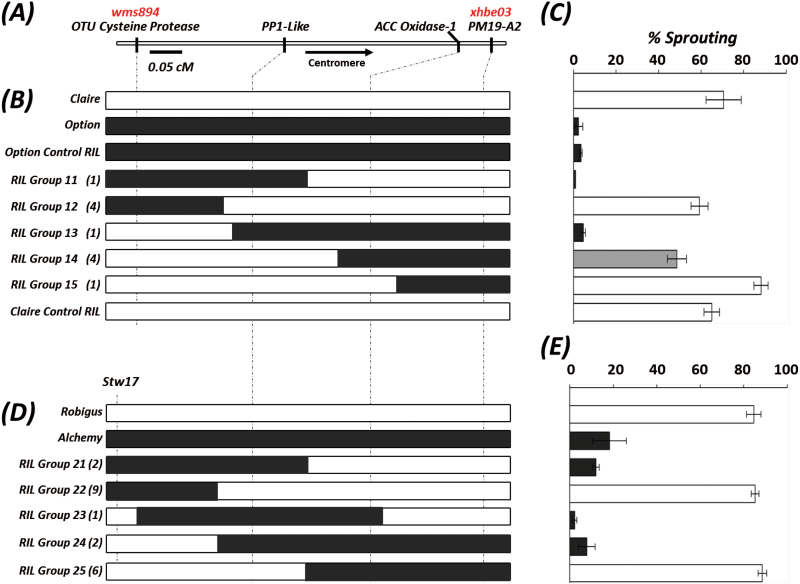
High-resolution fine-mapping of Phs-A1 in Option × Claire and Alchemy × Robigus RIL populations. (A) Linkage map of SNP (black) and SSR (red) markers across the Phs-A1 interval. The graphical genotype of Option × Claire RILs (B) and Alchemy × Robigus RILs (D) are aligned against their sprouting phenotype (C and E, respectively). RILs are grouped based on their recombination haplotype across the marker interval and the number of lines in each group is indicated in parentheses. Resistant parent alleles (Option and Alchemy) are represented in black, whereas the susceptible parent alleles (Claire and Robigus) are shown in white. Marker stw17 (2 cM distal to wms894) was used in the Robigus × Alchemy population as wms894 and OTU Cysteine Protease are monomorphic. The sprouting phenotype of each RIL group is designated as susceptible (white), moderate (grey) or resistant (black) based on statistical comparison with the parental controls. Error bars represents SEM.

