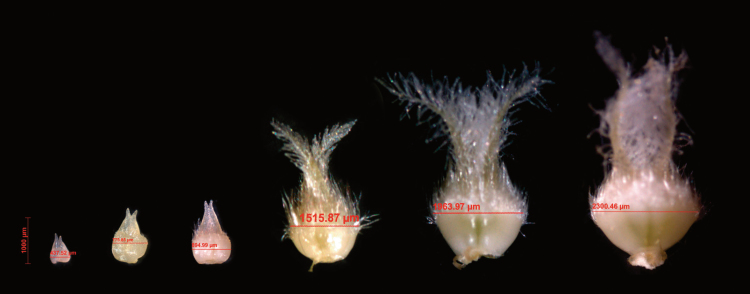
Fig. 3.
Wheat ovary growth and development over time. This figure shows the development of the ovary from early stages to AN and how ovary size was determined in this study. The first two ovaries are from F4 and F1 at GA stage, the third one is from F3 at yellow anther stage (this stage was defined in Guo and Schnurbusch, 2015), the fourth and fifth are from F3 and F1 at the heading stage (the stage was defined in Guo and Schnurbusch, 2015), the last ovary is from F1 at AN.

