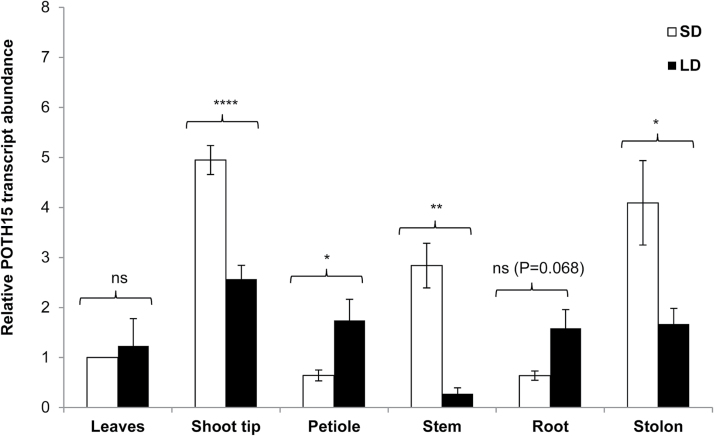
Fig. 2.
Tissue-specific abundance of POTH15. POTH15 transcript abundance in leaves, shoot tips, petioles, stems, roots and stolons of wild-type S. tuberosum ssp. andigena plants grown under SD and LD conditions for 15 d. Sixteen plants were transferred to soil and maintained under LD photoperiod for 8 weeks. Different tissues were harvested 15 d post SD/LD induction. Total RNA (1 µg) was reverse-transcribed using MMLV-RT and the gene-specific primers POTH15-qR2 for POTH15 and 18S-rRNA-RP for 18S-rRNA. qPCRs were performed on a Mastercylcer ep Realplex using primers POTH15-qF2 and POTH15-qR2 for POTH15, and 18S-rRNA-FP2 and 18S-rRNA-RP for 18S rRNA. 18S-rRNA was used for normalization for all the reactions. Data were analyzed using the 2–ΔΔCt method (Livak and Schmittgen, 2001). Data are mean ± standard deviations for three biological replicates. Fold-change in POTH15 transcript levels in different tissue types were calculated with respect to its level in leaves under SD conditions. * Represents significant difference at P≤0.05, ** P≤0.01, **** at P≤0.0001. ns = not significant at P<0.05.

