Fig. 4.
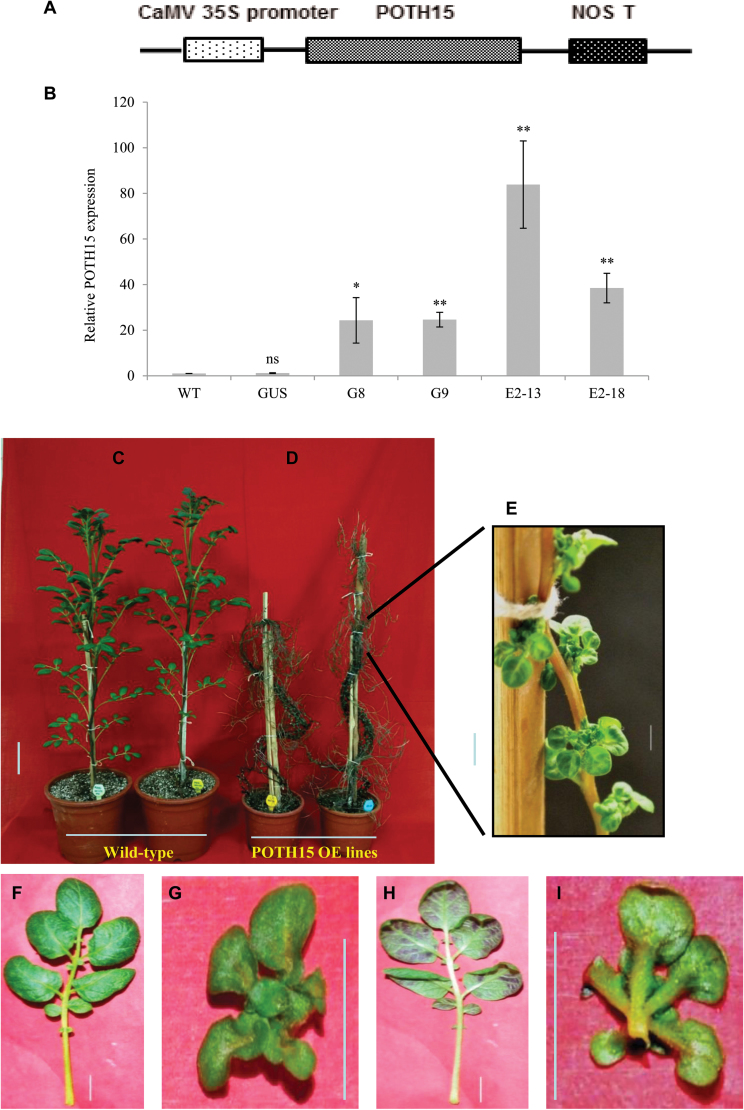
POTH15 overexpression (OE) drastically changes the plant architecture. The 35S::POTH15 construct (A). Relative mRNA levels of POTH15 in OE lines (G8, G9, E2-13, and E2-18) is shown with respect to controls, wild-type (WT), and 35S::GUS (GUS), from 12-week-old soil-grown plants under LD conditions (B). StActin mRNA was used as reference for normalization of qRT-PCR. The fold-change in RNA levels was calculated as the 2–ΔΔCt value relative to the mean values in WT sample. Data represent means ± standard deviations for two biological replicates, where shoot apexes from six independent plants were pooled for one biological replicate from each line. Data were analyzed by t-test separately for WT and each transgenic line. * and ** represent significant difference at P≤0.05 and P≤0.01, respectively. ns = not significant. Twelve-week-old wild-type potato plants (C) and POTH15 OE lines (D, E; where E is a close-up of D). The dorsal and ventral view of the leaves from wild-type (F, H) and POTH15 OE (G, I) lines. Scale bars: (C, D) 5cm; (E–I) 1cm.

