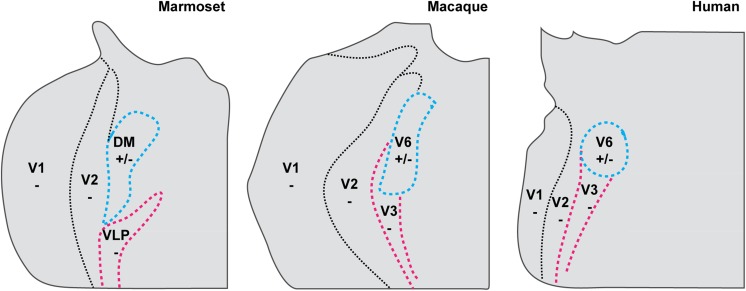
Fig. 11.
Comparison of the relative size and extent of two third tier visual areas in dorsal cortex. Left: Extents of areas VLP/V3 and DM in the marmoset relative to the dorsal halves (lower quadrant representations) of V1 and V2, based on the study of Rosa and Tweedale (2000). Middle and right: Extents of areas V3 and V6 in the macaque and human, based on Pitzalis et al. (2013); note that the diagrams are represented in right hemisphere convention, to facilitate comparison. Putative homologous areas are indicated by similar colors.

