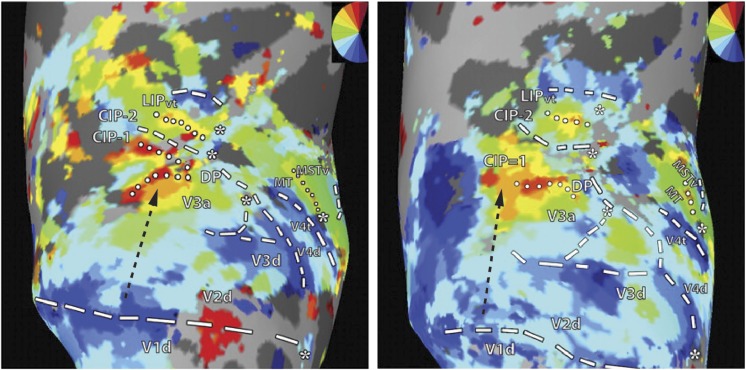
Fig. 12.
Macaque functional imaging data in dorsal extrastriate cortex. Reproduction of fMRI data obtained in the right hemispheres of two macaque monkeys by Arcaro et al. (2011; their Figures 1 and 2), in a study focused on the organization of the caudal intraparietal sulcus. The color code (top right inserts) represents the relationship between hemodynamic activation and the polar angle of stimuli presented in the visual field. The putative locations of dorsal visual areas (dashed contours indicate the representation of the lower vertical meridian, dotted contours the representation of the upper vertical meridian, and asterisks the representation of the central visual field), including V2 and V3, are shown in an inflated representation of the cortex, as indicated by the authors of the original study. Black dashed arrows point to a direct transition from V2 to an upper visual field representation, labeled V3A in the figure, i.e, however equally compatible with area DM directly abutting dorsal V2 (i.e., with the multiple-areas models, Fig. 1B and 1E), and the reinterpretation of the electrophysiological mapping studies in the macaque shown in Fig. 2.

