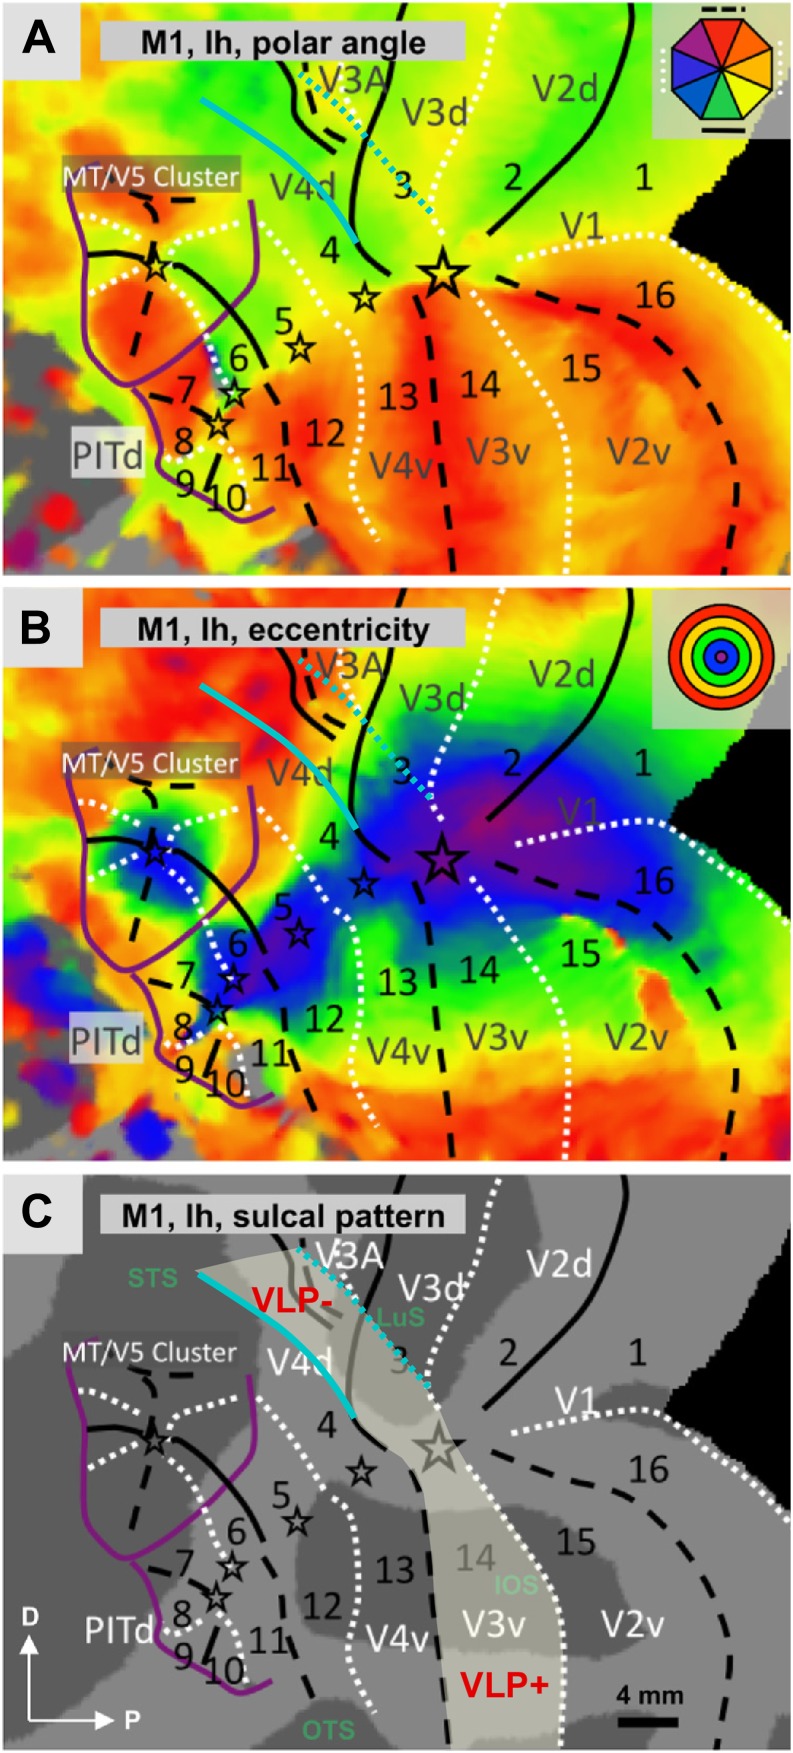
Fig. 13.
Macaque functional imaging data in lateral extrastriate cortex. Reanalysis of fMRI data obtained in the left hemisphere of a macaque monkey by Kolster et al. (2014; their Fig. 5), in a study focused on the organization of the cortex between areas V1 and MT. The color codes (top right in panels A and B) represent the relationship between hemodynamic activation and the polar angle (A) or eccentricity (B) of the visual stimuli. The locations of the visual field meridian representations that mark putative borders between visual areas, as originally assessed by the authors (based on the classical interpretation by Gattass et al. 1988) are indicated as follows: solid black lines – lower vertical meridian, dashed black lines – upper vertical meridian, white dotted lines – horizontal meridian. The stars indicate representations of the center of the fovea. In panel (A), we have indicated a reinterpretation of the same data, whereby a continuous representation of the lower vertical meridian arches rostrally across the prelunate gyrus (solid cyan line), and a continuous representation of the horizontal meridian arches rostrally across the rostral bank of the lunate sulcus and dorsal prelunate gyrus (dotted cyan line). When the data are reinterpreted in this way, a continuous area that resembles the proposed area VLP of marmoset monkeys becomes apparent (area shaded in lighter gray in panel C), which includes an ordered representation of eccentricity (B). The key point here is that the existing data on retinotopic organization, when taken in isolation, are equally compatible with multiple interpretations of the location of the lower quadrant representation that complements V3v/VP. Thus, resolution of this type of ambiguity must necessarily rely on the use of additional criteria, such as anatomical connections, cyto-and myeloarchitecture, or functional response properties. It is unclear why no representations of the upper quadrant are apparent in the dorsal region (which would be expected given earlier electrophysiological studies, see for example Figs. 2 and 12); this could be due to exclusion of more medial regions of the lunate/intraparietal transition from the regions that could be imaged at high resolution (given the location of imaging coils for the purpose of the experiment).

