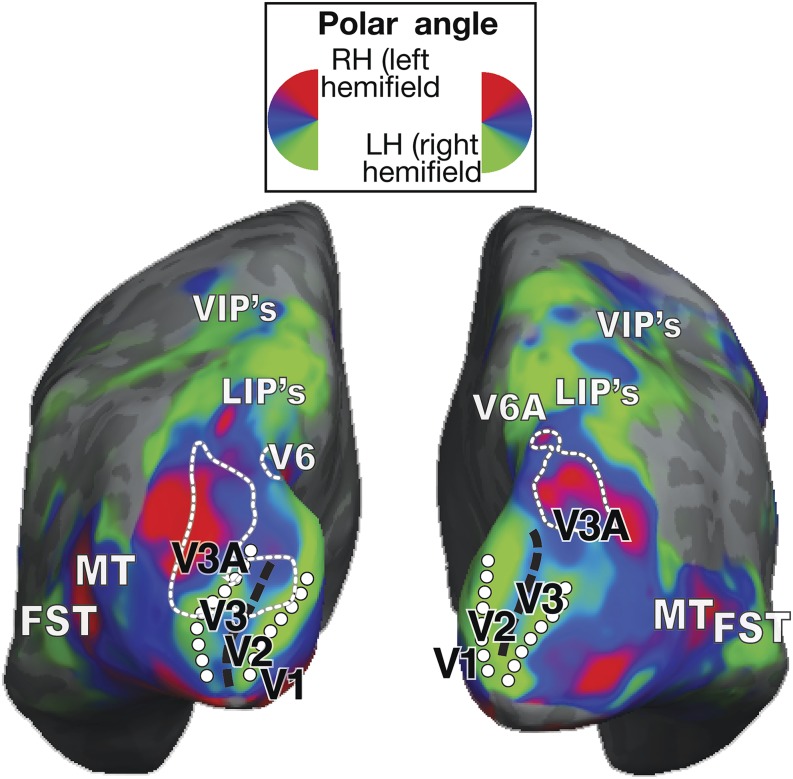
Fig. 14.
Relationship between retinotopy and densely myelinated zones in the human brain. Inflated representations of the left and right hemispheres of the human brain, seen from a dorsocaudal viewpoint, reproduced from Figure 3 of Sereno et al. (2013). The representation of polar angle in the cortex is depicted according to the color key. The white dotted lines indicate highly myelinated regions, estimated from the longitudinal relaxation rate (R1) in the MRI signal. In both hemispheres, the expected lower vertical meridian representation in dorsal V3 (green shading, and white circles) only reaches part way toward dorsomedial extrastriate cortex. Closer to the midline, one finds representations of the upper quadrant immediately rostral to the representation of the horizontal meridian that marks the border of V2 (blue shading, and black dashed line). This region is also characterized by dense myelination. These diagrams represent the average of six individuals, inflated to a common brain template.

