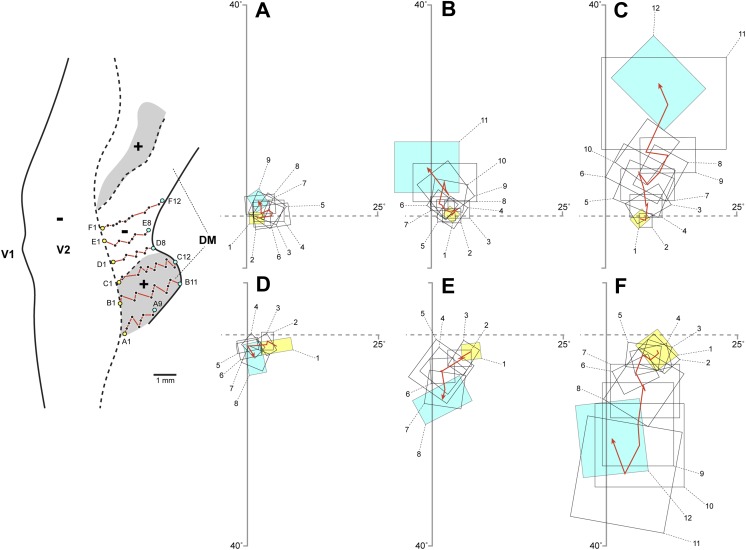
Fig. 5.
Visuotopy of the part of DM exposed on the dorsal surface of the brain. (A–F) Receptive fields recorded from neurons at different mediolateral levels of DM. The location of each receptive field is shown relative to the vertical and the horizontal meridians. Note that only a portion of the visual field (up to 30°) is represented in the dorsal portion of DM. In each sequence, the receptive field recorded from neurons in the most caudal site is numbered 1 and highlighted in yellow, and the receptive field recorded from neurons in the most rostral site is highlighted in blue. The red line and arrow connect the centers of the receptive fields, indicating the trend in visual topography as DM is crossed from caudal to rostral. Left: Flat reconstruction of the location of recording sequences A–F in DM. In this representation, gray shading delineates the regions of the upper quadrant representation. Note the similar receptive field sizes in the upper and lower quadrant representations, at comparable eccentricities. To facilitate comparisons, this diagram (from Rosa & Schmid, 1995) has been re-plotted following the same conventions as in other figures (right hemisphere, with receptive fields as seen by the experimenter on the surface of a hemispheric screen where stimuli were projected).

