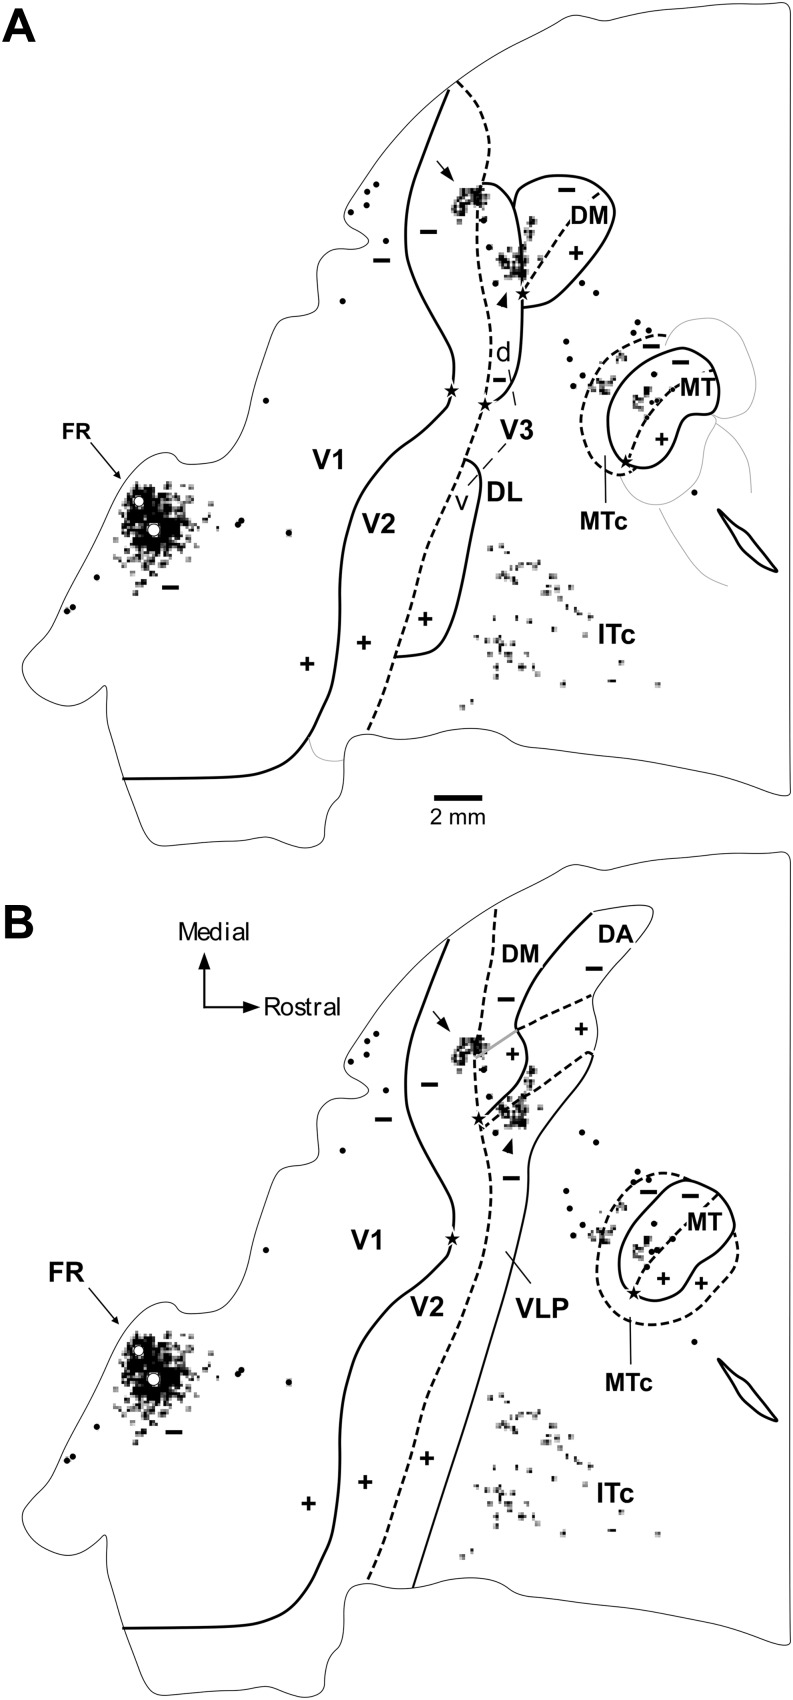
Fig. 8.
Connectional data used in support of the V3-only model, which we argue are, instead, inconsistent with this model, but consistent with the multiple-areas models. (A) Original interpretation, according to the V3-only model, of data shown in Figure 7D of Lyon and Kaas (2001), showing the distribution of labeled neurons in unfolded and flattened marmoset visual cortex resulting from two tracer injections (fluororuby, FR) in dorsal V1 near the horizontal meridian representation at parafoveal eccentricities. The white circles represent the estimated size of the injection sites. Other conventions are as in Figs. 1 and 7. (B) The same data are shown with the areal boundaries re-interpreted, according to the revised multiple-areas model. Notice that the topography revealed by this interpretation is consistent with the visual field location of the injection sites, unlike the interpretation shown in panel (A) (see text).

