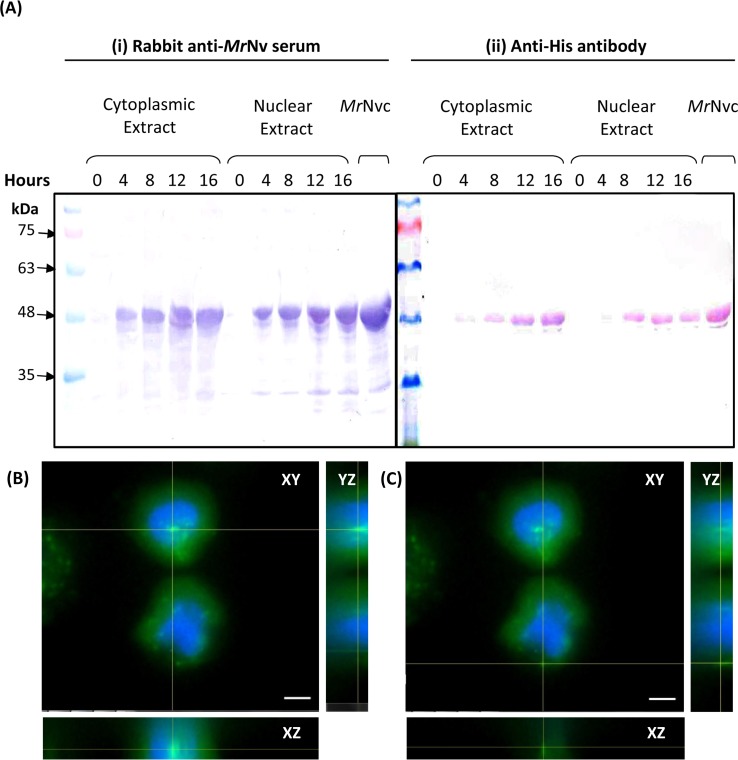
Figure 2. MrNvc distribution in Sf9 cytoplasmic and nuclear components.
(A) Western blot analysis of the cytoplasmic and nuclear components of Sf9 cells incubated with MrNvc VLPs (25 µg/ml) at different time (0, 4, 8, 12 and 16 h). Both cytoplasmic and nuclear extracts were probed with rabbit anti-MrNv serum (A(i)) and anti-His antibody (A(ii)). (B–C) The orthogonal view from the Z-stack images of the green fluorescence in the nucleus (B) and cytoplasm (C) of Sf9 cells incubated with MrNvc VLPs. Blue fluorescence indicates the cell nucleus. Yellow lines interception shows the location of the green fluorescent spots (F-MrNvc VLPs). Bars, 5 µm.

