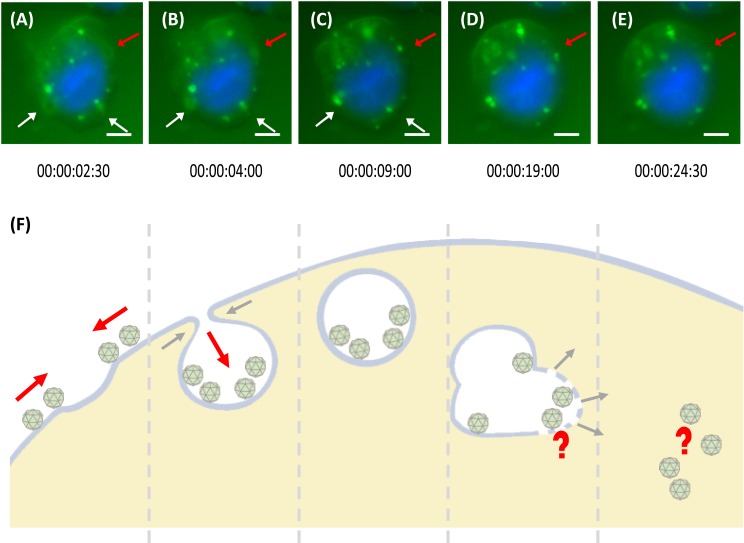
Figure 4. Trafficking mechanism of MrNvc VLPs into Sf9 cells.
(A–E) Live cell imaging of the formation of endosomes and endosomal escape of F-MrNvc VLPs. Sf9 cells were incubated with F-MrNvc VLPs at 4 °C for 1 h and shifted to RT for 30 min before they were viewed under a live cell imaging system. Each image was captured in 30 s time lapse for 1 h (Video S1). White arrows indicate endosome formation and red arrows show endosome formation to endosomal escape of VLPs. The live cell imaging image shows (A) the attached F-MrNvc VLPs were gathered around a hollow membrane pit, and (B) accumulated inside the pit. (C) Endosome enclosing the VLPs was formed. (D) The size and shape of the endosome become disproportionate and (E) F-MrNvc was released into the cytosol. These images were captured at the specified duration of time lapse (Video S1). (F) A schematic diagram summarising the whole process. Bars, (A–E) 5 µm.

