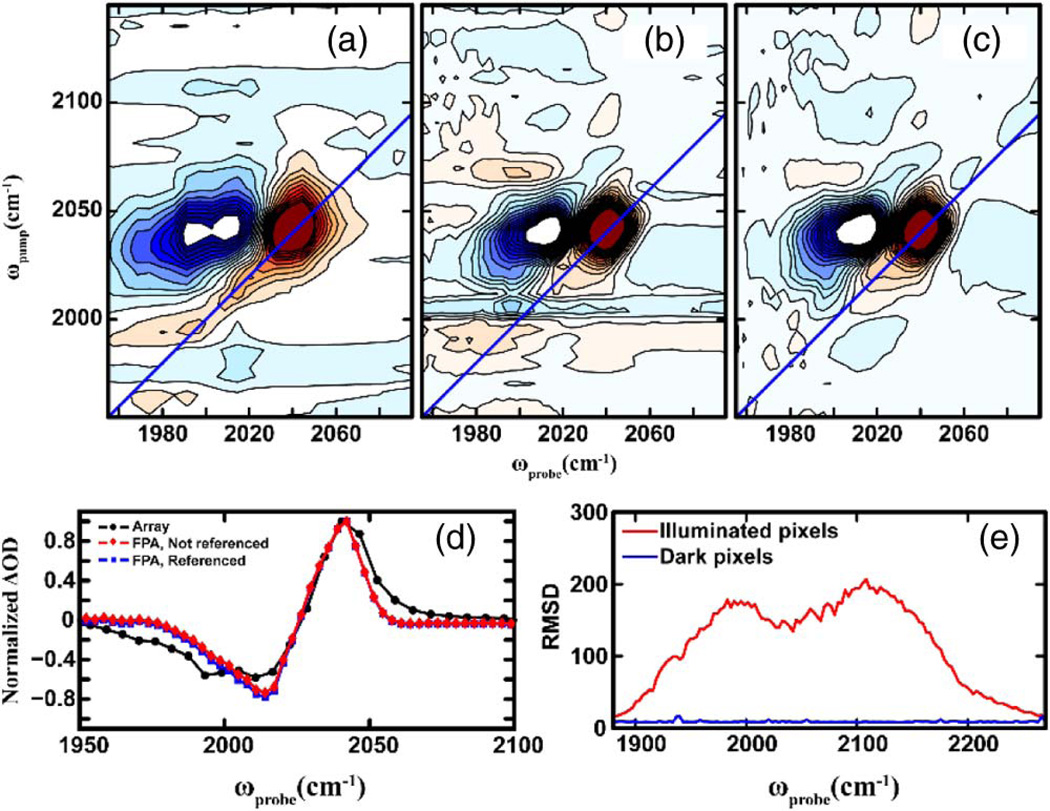
Fig. 2.
(a)–(c) Comparison of 2D IR spectra of NaN3 in D2O collected using a linear 1 × 32 array (a) and the 128 × 128 FPA, without and with referencing [(b) and (c)]. (d) Slices across the 2D spectra taken parallel to the probe axis at ωpump equal to the 2D peak maximum. (e) Comparison of the RMSD of illuminated and dark pixels of the FPA, calculated over a million laser shots.

