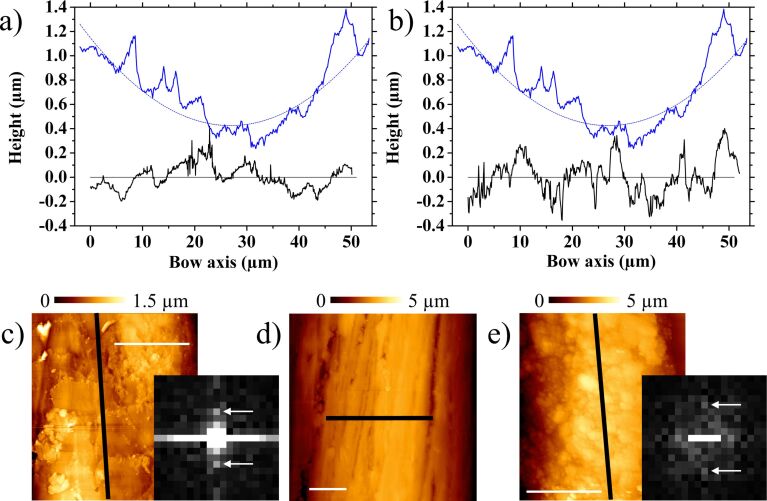
Figure 8.
Comparison between the same D-string (upper plots, blue lines) profile shown in Figure 6 and the profiles of sample 1 (a) and 2 (b) surfaces covered by rosin particles. The curved lines correspond to the same section of the cylinder depicted in Figure 6. (c–e) Profile extraction lines for sample 1 (c), the D-string (d), and sample 2 (e). Insets in c and e are the 0.5 × 0.5 µm−1 central areas of the corresponding two-dimensional fast Fourier transforms at the same intensity contrast. White arrows indicate frequencies associated with 9 µm (c) and 7 µm (e) vertical wavelengths. All white scale bars are 20 µm.

