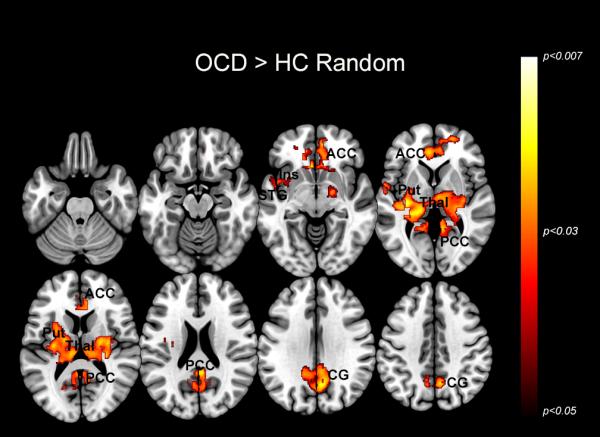
Figure 3.

The maps depict regions of exaggerated dACC modulation in OCD during the Random condition. The significant clusters (p<0.05, cluster level) are depicted across a mosaic of axial slices. This hyper-modulation by the dACC is seen in the anterior cingulate cortex (ACC), insula (Ins), superior temporal gyrus (STG), putamen (Put), thalamus (thal), posterior cingulate cortex (PCC), and cingulate gyrus (CG). The inset in the upper left of the figure depicts the task condition, with the squares representing the presentation of visual stimuli across time.
