Figure 4.

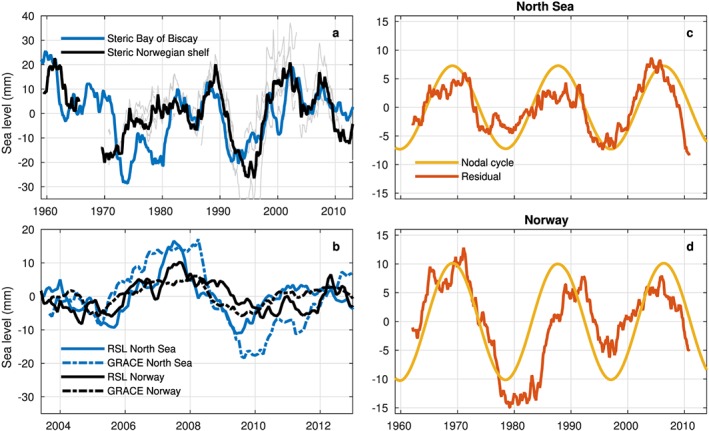
(a) Comparison between observed steric signal in the Bay of Biscay and the steric signal on the Norwegian shelf from hydrographic station measurements. Individual stations in grey. (b) GRACE on‐shelf mass signals and RSL for both regions. All time series in Figures 4a and 4b have been detrended and low‐pass filtered using a 25 month running mean. (c and d) Comparison of measured RSL after subtraction of all terms in equation (2), except for the nodal term versus the equilibrium nodal cycle. The residual time series have been detrended and low‐pass filtered using a 97 month running mean.
