Fig.4.

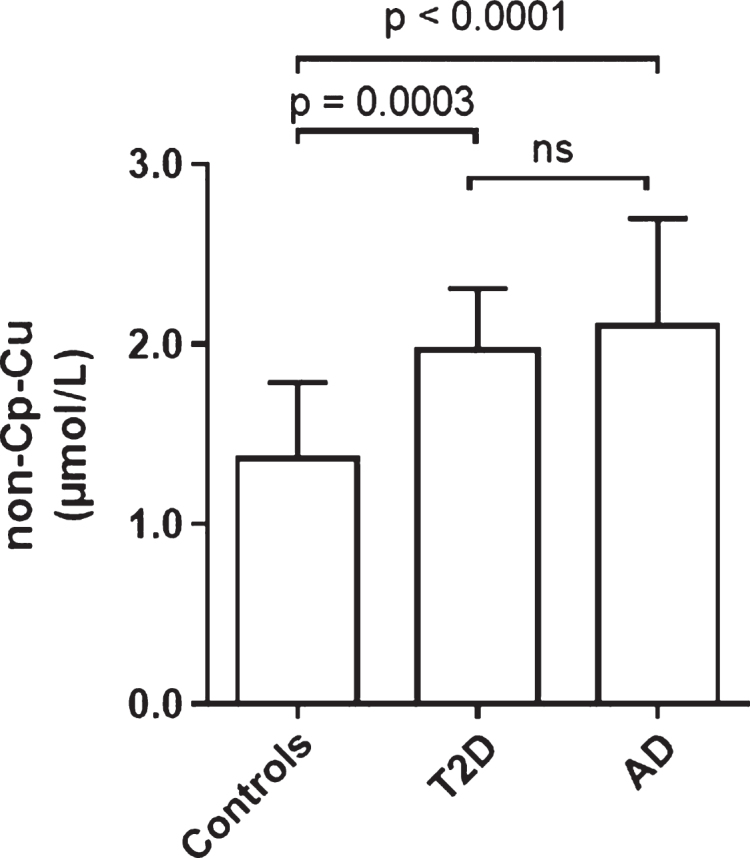
Comparison of non-Cp-Cu levels in Control, and T2D subjects to AD subjects. Scatter plots show the mean and SD of each group. p values determined by ANOVA.

Comparison of non-Cp-Cu levels in Control, and T2D subjects to AD subjects. Scatter plots show the mean and SD of each group. p values determined by ANOVA.