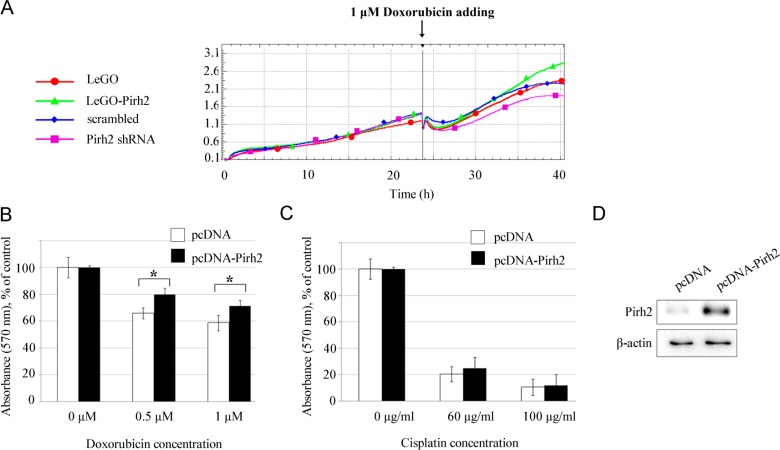
Figure 3. Pirh2 affects the resistance of H1299 cells to doxorubicin.
(A) Cell index graphs obtained for H1299 cells stably expressing LeGO-Pirh2, control LeGO, Pirh2 shRNA, and scrambled shRNA, respectively, which were exposed to 1 μM doxorubicin. Viability of H1299 cells transfected with the pcDNA-Pirh2 and control pcDNA plasmids after 24 h treatment with doxorubicin (0,5 μM and 1 μM) (B) or cisplatin (60 μg/ml and 100 μg/ml) (C) assessed by MTT assay. Error bars indicate ± SD within quadruplicate. Student's t-test was performed for Pirh2 overexpressing samples and their appropriate controls. *P<0.05. (D) Western blot analysis of Pirh2 protein levels in H1299 cells after transfection with pcDNA-Pirh2 or control pcDNA plasmids.

