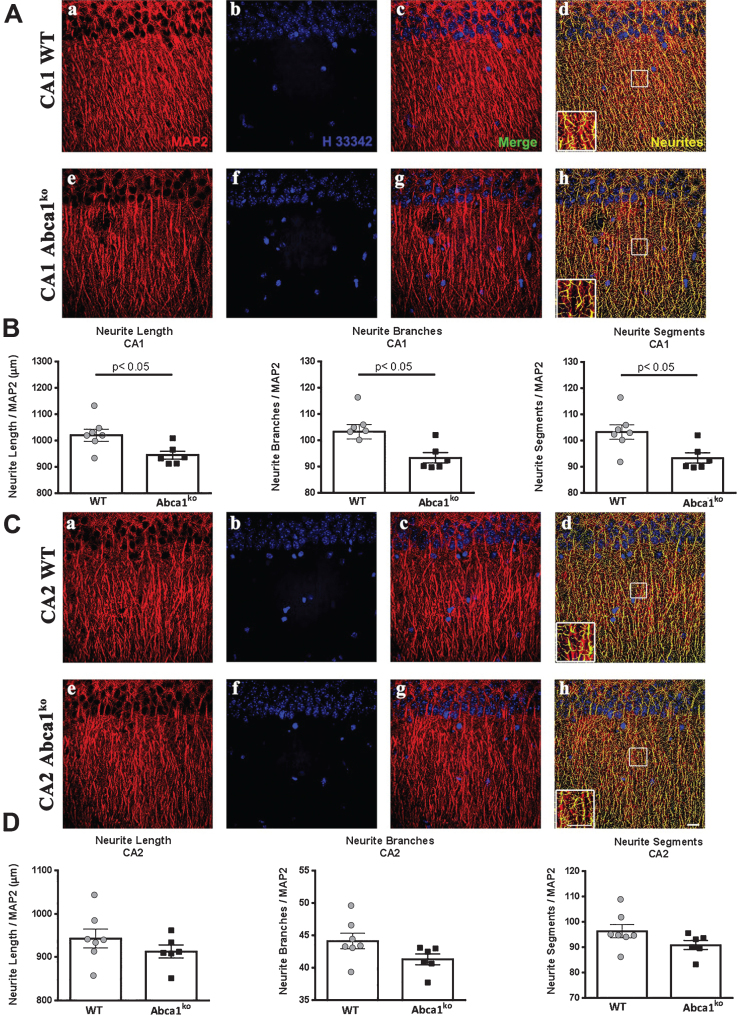
Fig.4.
Lack of Abca1 significantly affects dendritic architecture in CA1 but not CA2 region of the hippocampus. MAP2 and DAPI staining were used for dendritic tree reconstruction in the hippocampal CA1 and CA2 regions of WT and Abca1ko mice. Data were analyzed from a total of four images (60X confocal imaging) from each of the four sections for each mouse (n = 5–7 mice per group; 16 images per mouse). The total dendritic length, branch points and segments were quantified using Imaris filament tracing macros and were normalized to the total DAPI positive nuclei of the CA1 and CA2 regions. Analysis by t-test. A) Representative images for CA1 region (a –MAP2 staining in red, b – DAPI staining in blue, c – Merged MAP2 and DAPI staining, d – Imaris neurite tracings in yellow). B) Quantification of neurite length, segments, and branches. C) Representative images for CA2 region (scale bar = 100 μM). D) Quantification of neurite length, segments, and branches in the CA2 region. Note that lack of Abca1 significantly affects dendritic architecture in CA1 but not CA2 region of the hippocampus.

