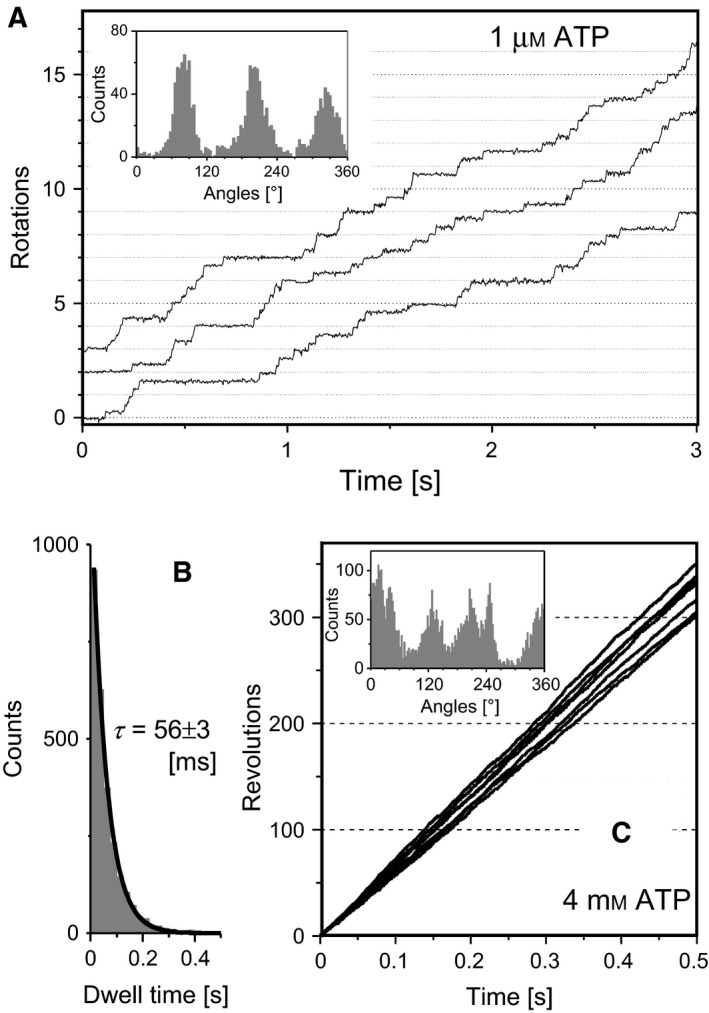
Figure 2.

Single‐molecule analysis of rotation of Escherichia coli‐expressed bovine F1. (A, B) Rotation of bovine F1 at 1 μm ATP observed with a camera 500 fps. (A) Time‐courses of the rotation. The inset is an angle histogram of the rotation. (B) A histogram of duration of dwells (N = 3672 dwells, three molecules) observed in the rotation. The bin width was 0.25 s. The histogram was best simulated with a single‐exponential decay function with a lifetime of 56 ± 3 ms. (C) Time‐courses of rotation at a saturating ATP concentration, 4 mm. Rotation was analyzed at 25k fps using Au particles (diameter was 40 nm) as a rotation probe. The inset is an angle histogram of the rotation. The averaged rotation speed over 0.5 s was 655 ± 38 rps (N = 6 molecules).
